Showing posts with label Morphology. Show all posts

Thursday, December 26, 2019

Building up or spreading out? Urban growth across 478 cities

New paper by the Seto Lab in collaboration with Anjali Mahendra (who is also onTwitter).

Mahtta, R., Mahendra, A., & Seto, K. C. (2019). Building up or spreading out? Typologies of urban growth across 478 cities of 1 million+. Environmental Research Letters, 14(12), 124077.

Abstract
Urban form in both two- (2D) and three-dimensions (3D) has significant impacts on local and global environments. Here we developed the largest global dataset characterizing 2D and 3D urban growth for 478 cities with populations of one million or larger. Using remote sensing data from the SeaWinds scatterometer for 2001 and 2009, and the Global Human Settlement Layer for 2000 and 2014, we applied a cluster analysis and found five urban growth typologies: stabilized, outward, mature upward, budding outward, upward and outward. Budding outward is the dominant typology worldwide, per the largest total area. Cities characterized by upward and outward growth are few in number and concentrated primarily in China and South Korea, where there has been a large increase in high-rises during the study period. With the exception of East Asia, cities within a geographic region exhibit remarkably similar patterns of urban growth. Our results show that every city exhibits multiple urban growth typologies concurrently. Thus, while it is possible to describe a city by its dominant urban growth typology, a more accurate and comprehensive characterization would include some combination of the five typologies. The implications of the results for urban sustainability are multi-fold. First, the results suggest that there is considerable opportunity to shape future patterns of urbanization, given that most of the new urban growth is nascent and low magnitude outward expansion. Second, the clear geographic patterns and wide variations in the physical form of urban growth, within country and city, suggest that markets, national and subnational policies, including the absence of, can shape how cities grow. Third, the presence of different typologies within each city suggests the need for differentiated strategies for different parts of a single city. Finally, the new urban forms revealed in this analysis provide a first glimpse into the carbon lock-in of recently constructed energy-demanding infrastructure of urban settlements.

ps. The image below was taken from the WRI report that originated the paper.

Monday, May 11, 2015

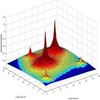
A Simple Index to compare Urban Centrality: Mono vs Polycentric Cities

warning: this post contains self-promotion.

Pereira, R. H. M., Nadalin, V., Monasterio, L., Albuquerque, P. H. M. (2013). Urban Centrality: A Simple Index. Geographical Analysis. doi:10.1111/gean.12002
Abstract: This study introduces a new measure of urban centrality. The proposed urban centrality index (UCI) constitutes an extension to the spatial separation index. Urban structure should be more accurately analyzed when considering a centrality scale (varying from extreme monocentricity to extreme polycentricity) than when considering a binary variable (monocentric or polycentric). The proposed index controls for differences in size and shape of the geographic areas for which data are available, and can be calculated using different variables such as employment and population densities, or trip generation rates. The properties of the index are illustrated with simulated artificial data sets and are compared with other similar measures proposed in the existing literature. The index is then applied to the urban structure of four metropolitan areas: Pittsburgh and Los Angeles in the United States; São Paulo, Brazil; and Paris, France. The index is compared with other traditional spatial agglomeration measures, such as global and local Moran's I, and density gradient estimations. 

Here is the ungated versionn of the paper. 

Friday, February 20, 2015

An Agent-Based Simulation of the Urban Growth in Latin American cities

Barros, Joana (2012). Exploring urban dynamics in Latin American cities using an agent-based simulation approach. In Agent-based models of geographical systems (pp. 571-589). Springer Netherlands. [Ungated version here, and PhD Thesis here]

Abstract:
This paper focuses on a specific kind of urban growth that happens in Latin American cities, called 'Peripherisation'. This is characterised by the formation of low-income residential areas in the peripheral ring of the city and a perpetuation of a dynamic core-periphery spatial pattern. The dynamics of growth and change in Latin American cities are explored using agent-based simulation. The objective is to increase the understanding of urban spatial phenomena in Latin American cities, which is essential to providing a basis for future planning actions and policies. Simulation exercises were used to revisit assumptions about urbanisation issues in Latin American cities and investigate important aspects of growth and change in these cities. These exercises allowed the problem of urban growth in Latin American cities to be unfolded through their dynamics, relating these dynamics to urban morphology, and thus presenting a new and important perspective on the phenomenon.

Thursday, July 24, 2014

Population distribution in European capitals


The map shows a fine-scale spatial population distribution in selected European capitals. The high resolution map is here, and it comes from this paper:


Batista e Silva, F., Gallego, J., Lavalle C. (2013). A high-resolution population grid map for Europe. Journal of Maps 9(1):16-28.

Abstract:
Population figures are usually collected by national statistical institutes at small enumeration units (e.g. census tracts or building units). However, still for many countries in Europe, data are distributed at coarser geographical units like municipalities. This level of resolution is insufficient for analysis in many fields. In addition, the heterogeneity of the size of the geographical units causes great distortions in analysis, i.e. the Modifiable Areal Unit Problem (MAUP). Dasymetric mapping techniques have long been applied world-wide to derive finer (and MAUP-free) depictions of the population distribution. These techniques disaggregate population figures reported at coarse source zones into a finer set of zones using ancillary geographical data. ... In this article, we test new geographical datasets to produce an updated and improved European population grid map. ... As final outcome of this cartographic exercise, a European population grid map for the reference year of 2006, with a spatial resolution of 100 × 100 meters, is presented and validated against reference data. Resident population reported at commune level, a refined version of CLC and information on the soil sealing degree are used as the main inputs to produce the final map.


Related Paper and data:

Friday, May 2, 2014

Urban Density Patterns in 9 Global Cities

Here is a nice 'chart' comparing population density patterns across nine global cites. The chart is part of a broader analysis by the LSE Cities programme and their not so new  project Urban Age.


[Click on the image to enlarge it]
[image credit: LSE Cities]


Related Links:

Monday, December 9, 2013

Urban Modelling back in 1976


The other day I was wandering in the library when I bumped into the book Urban Modelling: Algorithms, Calibrations, Predictions, published by M. Batty back in 1976 (!). Since then, he and his team at CASA have made many contributions to the field of urban studies with new modelling developments and applications.


Some of the softwares developed at CASA (including GMap Creator) are available for download here. You can play with your own Von Thunen Model!

[Image Credit: CASA]

Related Links:

Tuesday, October 29, 2013

Urban Picture

Would you call this urban sprawl? (via Human Scale Cities, a great blog by the way).
Los Angeles
[Image Credit: ?]

Soundtrack:

Friday, June 7, 2013

Growth and change in metropolitan form

The City Form Lab (SUTD/MIT) has a research project on measuring urban expansion, particularly focused in East Asia. They have recently published the 'Progress report on urban form and land use measures'. After scanning the report, I'm definitely adding it to my reading list.


[Image Credit: SUTD City Form Lab]

Sunday, May 19, 2013

The Geometry of Sound Visualized

Turn down your speakers … but not all of the way off. Now see what sound waves look like when they’re visualized and the geometric patterns they make. A little bit of history here.

(via Open culture)

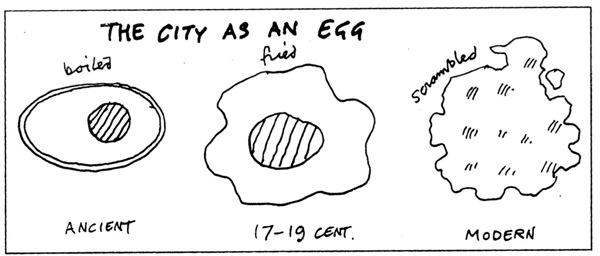
Low frequency part (at 0:40) reminds me of this fried egg city, and high frequency part (at 1:52) reminds me of Christaller's network of central places. Probably, there is already an author using complexity theory to freak out on this stuff.


Related Link:

Thursday, August 30, 2012

Urban Centrality Index (self promotion)

Good news. My paper with Monasterio, Nadalin and Albuquerque on Urban Centrality has been accepted for publication in Geographical Analysis !


Quantifying urban centrality: a simple index proposal and international comparison.
Abstract: This study introduces a new measure of urban centrality. The proposed urban centrality index (UCI) constitutes an extension to the spatial separation index (Midelfart-Knarvik et al., 2000). Urban structure should be more accurately analyzed when considering a centrality scale (varying from extreme monocentricity to extreme polycentricity) rather than being considered as a binary variable (monocentric or polycentric). The proposed index controls for differences in size and shape of the geographic areas for which data are available, and can be calculated using different variables such as employment and population densities or trip generation rates. The properties of the index are illustrated with simulated artificial datasets and compared to other similar measures proposed in the previous literature. Then the index is applied to the urban structure of four different metropolitan areas: Pittsburgh and Los Angeles in the United States; São Paulo, Brazil; and, Paris, France. The index is compared to other traditional spatial agglomeration measures, such as global and local Moran’s I, and density gradient estimations.


Wednesday, August 29, 2012

One Hundred Years of Land Values

Gabriel Ahlfeldt (LSE) presents at the Lincoln Institute his project on digitizing data from the Olcott's land values blue book of Chicago. The Olcott's Blue Books (under public domain) bring a unique dataset of historical land values, land uses, building heights, and other information in Chicago and its suburbs, published annually between 1900 and 1990 (!)

You can  get green with envy and  watch the presentation here.