Showing posts with label environment. Show all posts
Showing posts with label environment. Show all posts
Thursday, February 13, 2020

Friday, June 21, 2019
Who pollutes and who gets exposed to road traffic-related air pollution in the UK
In 2003, Gordon Mitchell and Danny Dorling published "An environmental justice analysis of British air quality", a widely cited paper that became a key reference in the environmental justice literature. Now, 16 years latter, a new paper by Joanna Barnes (Twitter), Tim Chatterton (Twitter) and James Longhurst update the original study with new data and more in depth analysis on the social inequalities in traffic-related pollution exposure and emission.
Barnes, J. H., Chatterton, T. J., and; Longhurst, J. W. (2019). Emissions vs exposure: Increasing injustice from road traffic-related air pollution in the United Kingdom. Transportation Research Part D: Transport and Environment, 73, 56-66.
This paper presents unique spatial analyses identifying substantial discrepancies in traffic-related emissions generation and exposure by socioeconomic and demographic groups. It demonstrates a compelling environmental and social injustice narrative with strong policy implications for the UK and beyond.In the first instance, this research presents a decadal update for England and Wales to Mitchell and Dorling’s 2003 analysis of environmental justice in the UK. Using 2011 UK Government pollution and emissions data with 2011 UK Census socioeconomic and demographic data based on small area census geographies, this paper demonstrates a stronger relationship between age, poverty, road NOxemissions and exposure to NO2 concentrations. Areas with the highest proportions of under-fives and young adults, and poorer households, have the highest concentrations of traffic-related pollution.In addition, exclusive access to UK annual vehicle safety inspection records (‘MOT’ tests) allowed annual private vehicle NOx emissions to be spatially attributed to registered keepers. Areal analysis against Census-based socioeconomic characteristics identified that households in the poorest areas emit the least NOxand PM, whilst the least poor areas emitted the highest, per km, vehicle emissions per household through having higher vehicle ownership, owning more diesel vehicles and driving further.In conclusion, the analysis indicates that, despite more than a decade of air quality policy, environmental injustice of air pollution exposure has worsened. New evidence regarding the responsibility for generation of road traffic emissions provides a clear focus for policy development and targeted implementation.
Related post:

credit: Barnes et al 2019

Friday, June 8, 2018
Globally consistent estimate of carbon footprints of 189 countries and 13,000 cities
Daniel D Moran et colleagues developed the Global Gridded Model of Carbon Footprints (GGMCF). This model provides a globally consistent and spatially resolved (250m) estimate of carbon footprints in per capita and absolute terms across 189 countries. Their paper got recently accepted for publication (see below) and their data is freely available. Kudos to the team!
Moran, D., Kanemoto, K., Jiborn, M., Wood, R., Többen, J., & Seto, K. (2018). Carbon footprints of 13,000 cities. Environmental Research Letters.
Abstract:
While it is understood that cities generate the majority of carbon emissions, for most cities, towns, and rural areas around the world no carbon footprint (CF) has been estimated. The Gridded Global Model of City Footprints (GGMCF) presented here downscales national CFs into a 250m gridded model using data on population, purchasing power, and existing subnational CF studies from the US, China, EU, and Japan. Studies have shown that CFs are highly concentrated by income, with the top decile of earners driving 30-45% of emissions. Even allowing for significant modeling uncertainties, we find that emissions are similarly concentrated in a small number of cities. The highest emitting 100 urban areas (defined as contiguous population clusters) account for 18% of the global carbon footprint. While many of the cities with the highest footprints are in countries with high carbon footprints, nearly one quarter of the top cities (41 of the top 200) are in countries with relatively low emissions. In these cities population and affluence combine to drive footprints at a scale similar to those of cities in high-income countries. We conclude that concerted action by a limited number of local governments can have a disproportionate impact on global emissions.

credit: Moran et al
Tuesday, May 29, 2018
Assorted Links
- Using geolocated tweets and the Google Books datasets to map the Americanization of English in space and time, by Bruno Gonçalves et al.
- Sony World Photography Awards 2018
- Interactive maps with deforestation and reforestation of national parks at the border between Brazil and Argentina, between the 1950s and the 2010s, including some aerial and satellite pictures from US spy satellites from the 1960s. via Frederico Freitas
- Why the New Research on Mobility Matters - via Juan Pablo Chauvin
- Do peoples' judgments on hypothetical trolley dilemmas predict what they would do in a real-life trolley dilemma situation? via Dina Pomeranz
- Meaning of the colors in country flags. The explanation of the Brazilian flag hurts
- Life expectancy vs. health expenditure over time... needless to say the USA has a problem here. via Max Roser et al at Our World in Data

Wednesday, November 8, 2017
How Pollution Compares With Other Causes Of Global Deaths
The Lancet Commission on pollution and health has recently published a report that calls attention to the fact that pollution kills 3 times more than AIDS, tuberculosis and malaria combined. There is a good summary of the report in this piece, by NPR.
This chart below was created by Brittany Mayes and Matthew Zhang for the NPR piece, and it is based on data from the Global Health Data Exchange. Thanks Linsey Marr for the pointer on Twitter.

[click on the image to enlarge it]

Thursday, October 13, 2016
Assorted Links
- The Lone Man Building a Cathedral By Hand
- Language Evolution Simulation w/ Agent-Based Modeling via Mara Averick
- A research consortium is collecting DNA samples from subway systems around the world to improve our understanding of infectious disease in cities. Here is the interactive map of subway bacteria in New York
- People Are Using Britain's New Plastic Money to Play Vinyl Records
- Layered Drawings Exploring The Passing Of Time
- A bird that "sings" like chain saw, photographic cameras and car alarms
- Great maps by John Nelson on Five Years of Drought in the US

credit: John Nelson
Tuesday, October 4, 2016
Inequalities, cities, big data, transport and health
These are the core issues covered in five special issues of top journals this year, what I think reflects how these topics and particularly cities and social inequality have gained strong momentum in recent years.

- Nature: Science and Inequality
- Nature: a
not sonew urban agenda and the UN’s Habitat III meeting - Science: Urban Planet
- Built Environment: Big data and the city
- The Lancet: Urban design, transport, and health

 |
Tuesday, September 13, 2016
Measuring exposure to air pollution using mobile phone data
Tijs Neutens and colleagues have a new paper where they use mobile phone data to assess people's exposure to air
pollution in Belgium in high spatio-temporal resolution. Some of you might be interested (via GAUMAS).
Dewulf, B., et al. (2016). Dynamic assessment of exposure to air pollution using mobile phone data. International journal of health geographics, 15(1), 1.

image credit: Dewulf, et al. (2016)
Tuesday, August 9, 2016
Air quality in world cities by hour of the day
This comes from The Economist's Daily chart, where you can find other indicators and more information on the methodology (more here).

click on the image to enlarge it

credit: The Economist's Daily chart
Sunday, July 31, 2016
Assorted Links
- Luc Anselin and team join University of Chicago with new Center for Spatial Data Science (ht Kyle Walker)
- Skydiver makes parachute-free jump from 25,000 feet (~7,600 metres) and survives!
- The Discipline of Philosophy Visualized with Mapping Software: See All of the Complex Networks
- Free CAD files of more than 200 major world cities (ht Fabio Storino)
- Keep these pictures away from your hipster friend
- A map maker bot that automatically generates maps based on data of the Census American Community Survey
- Portugal runs for four days straight on renewable energy alone via Idalina Baptista
- Analyzing 22 milion bike rides in the NYC Bike Share System in R

Tuesday, July 19, 2016
Assorted Links
- Jack Caldwell has passed away
-
- The easiest way to simplify your shape file
, making it look like a child's drawing(ht Leo Monasterio) -
-
-
- Garry Kasparov talking about the The limits of human performance and artificial intelligence
- Great infographic showing Language Families

Wednesday, May 11, 2016
Justice and ethical concerns in Energy decisions
The latest issue of Nature Energy is out. There is an interesting paper that puts together a miscellaneous of concepts from different theories in political philosophy to build an "energy justice framework centred on availability, affordability, due process, transparency and accountability, sustainability, equity and responsibility".

The authors recognize eventual conflicts between these different ideas but I think they don't make it very clear how the ethical framework they propose actually overcomes such conflicts. In any case, it's a good read.
Thanks Tim Schwanen for the tip.
Friday, April 15, 2016
Assorted Links
- Government surveillance planes routinely circle over most major cities in the USA
- Neat 3D globe animation of atmospheric flow on Earth
- Lego versions of Brutalist buildings (via Tyler Cowen)
- An interactive tour to Bosch's “The Garden of Earthly Delights”
- CityBikes API Documentation, via Leo Monasterio
- Book: Batty & Longley (1994) Fractal Cities: A Geometry of Form and Function (ht Iury Lima)
- What's really warming the world?
- Top speeds of elevators in eight of the world's tallest buildings. I guess this proves that procrastination has no limits
- Data-Mining photos from the Internet to create time-lapse videos - via Achim Tack
Sunday, January 10, 2016
Sex is another good reason to stop climate change, apparently
Hotter temperatures reduce sex drive and lower birth rates, according to a recent study published as a NBER Working Paper. There is a good summary of the paper here. I kind of liked the conclusion in the abstract.
Barreca, A., Deschenes, O., & Guldi, M. (2015). Maybe Next Month? Temperature Shocks, Climate Change, and Dynamic Adjustments in Birth Rates (No. w21681). NBER Working Paper.
Barreca, A., Deschenes, O., & Guldi, M. (2015). Maybe Next Month? Temperature Shocks, Climate Change, and Dynamic Adjustments in Birth Rates (No. w21681). NBER Working Paper.
Abstract:
Dynamic adjustments could be a useful strategy for mitigating the costs of acute environmental shocks when timing is not a strictly binding constraint. To investigate whether such adjustments could apply to fertility, we estimate the effects of temperature shocks on birth rates in the United States between 1931 and 2010. Our innovative approach allows for presumably random variation in the distribution of daily temperatures to affect birth rates up to 24 months into the future. We find that additional days above 80 °F cause a large decline in birth rates approximately 8 to 10 months later. The initial decline is followed by a partial rebound in births over the next few months implying that populations can mitigate the fertility cost of temperature shocks by shifting conception month. This dynamic adjustment helps explain the observed decline in birth rates during the spring and subsequent increase during the summer. The lack of a full rebound suggests that increased temperatures due to climate change may reduce population growth rates in the coming century. As an added cost, climate change will shift even more births to the summer months when third trimester exposure to dangerously high temperatures increases. Based on our analysis of historical changes in the temperature-fertility relationship, we conclude air conditioning could be used to substantially offset the fertility costs of climate change.
Friday, December 11, 2015
Assorted Links
- Cities bask in spotlight at Paris climate talks
- Why drivers in China intentionally kill the pedestrians they hit ht Leo Monasterio
- How complete is OpenStreetMap data coverage?
- How the United States generates its electricity
- A real-time map of cyber attacks via Flowing Data
- Autonomous Vehicles Need Experimental Ethics: Are We Ready for Utilitarian Cars? via Cesar Hidalgo
- A crowdsourced and open database for
 wheelchair-accessible places
 - Seven days of carsharing in Milan (project website)
Tuesday, December 1, 2015
Climate change and the state of carbon consumption
Consumption, Consumption, Consumption. Nice videographic, by The Economist.
China and India are perceived to be the worst emitters of carbon dioxide, but that view is not so clear when adjustments are made for population, GDP levels, and carbon consumption per person.
Tuesday, July 7, 2015
Assorted Links
- Beijing Quadrupled in Size in a Decade, NASA Finds
- Delhi metro could soon run completely on solar power
- 25+ Of The Most Majestic Libraries In The World
- What the coast cities of US and China might look like if predictions of rise sea levels are confirmed
- Great pictures of "International Borders Around The World"
- Good Dani Rodrik powerpoints on labor migration (pdf) via MR
- Self-driving Toilets might be the next 'invention' of Google
- Google has built a virtual simulation of California to test its self-driving cars (via Francesco M. Cerroni)
Monday, March 2, 2015
Air pollution in Asian Cities
China is internationally famous for its bad air quality. So I was quite surprised to know that India has even higher levels of air pollution in many cities.

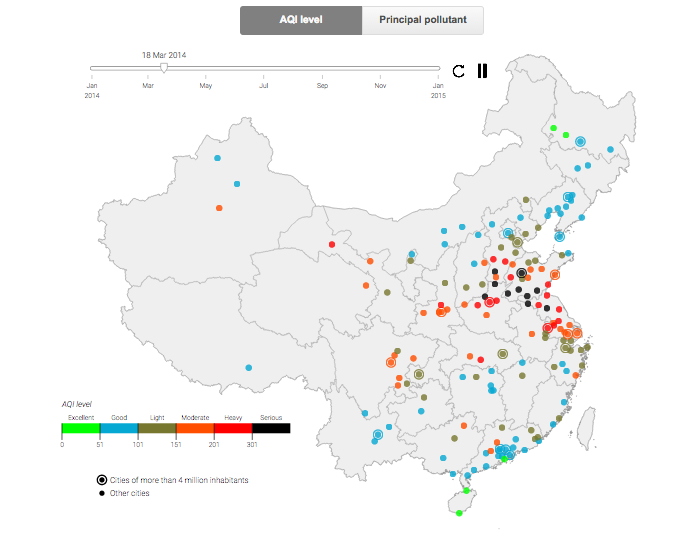
ps. Angel Hsu has pointed out to this interactive map showing the air pollution levels in some Chinese cities in 2014. Data comes from the Ministry of Environmental Protection and you can download it here.
Thursday, January 15, 2015
Blade Runner 2019? No! Beijing, today
Blade Runner?
No!
Beijing, today. pic.twitter.com/JB6lUGLzg0
— Puño (@punodraws) January 14, 2015
Thursday, November 20, 2014
NASA's high-resolution computer model of CO2 emission
A couple of weeks ago, we wrote a short post about NASA's project to monitor Urban Greenhouse Gas Emissions from Space using a new satellite, the Orbiting Carbon Observatory-2 (OCO-2).
NASA has recently released a new stunning animation using the results of a high-resolution computer model of CO2 emissions on Earth's atmosphere'. (HT Franziska Gaupp, who is working with drought modeling and food supply here at Oxford)
Subscribe to:
Posts (Atom)