Showing posts with label Metropolitan Areas. Show all posts

Monday, April 13, 2020

The delineation and growth of metropolitan areas in the world between 2000 and 2015

A talented team at the OECD and the European Union have developed a consistent method to delineate metropolitan areas – or functional urban areas (FUAs) – in the entire world. They recently published an open access paper where the explain the method and use it to analyze the population growth of metropolitan areas in the world between 2000 and 2015. You can find more info about the paper below and  a geopackage data set of  FUAs can downloaded from here

Moreno-Monroy, A. I., Schiavina, M., & Veneri, P. (2020). Metropolitan areas in the world. Delineation and population trends. Journal of Urban Economics, 103242. 

Abstract
This paper presents a novel method to delineate metropolitan areas – or functional urban areas (FUAs) – in the entire world and assesses their population trends. According to the definition developed by the OECD and the European Union, FUAs are composed of high-density urban centres with at least 50 thousand people plus their surrounding commuting zones. The latter represent the urban centres’ areas of influence in terms of labour market flows. The proposed method combines a functional and a morphological approach to overcome the dependency on travel-to-work data to define commuting zones and allow a global delineation. It relies on a probabilistic approach and the use of population and travel impedance gridded data across the globe. Results show that around 3.9 billion people, making up 53% of the world population, live in 8,790 FUAs, out of which 17% live in their commuting zones. Between 2000 and 2015, population growth was higher in larger FUAs, highlighting a general trend toward higher concentration of the metropolitan population. Commuting zones grew faster than urban centres, though with heterogeneous patterns across world regions, income levels and metropolitan size.


Related posts:

Sunday, January 5, 2020

Plotting the metropolitan areas of Brazil in R

Here is a simple R script to download the shape files of Brazilian metropolitan areas by year and plot them in R.

obs. It's important to note that, since the 1988, metro areas are created by state governments. As a rule, this is done with absolutely no transparency nor any technical criteria. It is this legal issue, rather than the urbanization process in the country itself, that led to such an inflated increase in the number of metro areas in the country over the past two decades.

Number of metro areas in Brazil:
1970: 9
2001: 24 
2018: 77

Thursday, July 24, 2014

Population distribution in European capitals


The map shows a fine-scale spatial population distribution in selected European capitals. The high resolution map is here, and it comes from this paper:


Batista e Silva, F., Gallego, J., Lavalle C. (2013). A high-resolution population grid map for Europe. Journal of Maps 9(1):16-28.

Abstract:
Population figures are usually collected by national statistical institutes at small enumeration units (e.g. census tracts or building units). However, still for many countries in Europe, data are distributed at coarser geographical units like municipalities. This level of resolution is insufficient for analysis in many fields. In addition, the heterogeneity of the size of the geographical units causes great distortions in analysis, i.e. the Modifiable Areal Unit Problem (MAUP). Dasymetric mapping techniques have long been applied world-wide to derive finer (and MAUP-free) depictions of the population distribution. These techniques disaggregate population figures reported at coarse source zones into a finer set of zones using ancillary geographical data. ... In this article, we test new geographical datasets to produce an updated and improved European population grid map. ... As final outcome of this cartographic exercise, a European population grid map for the reference year of 2006, with a spatial resolution of 100 × 100 meters, is presented and validated against reference data. Resident population reported at commune level, a refined version of CLC and information on the soil sealing degree are used as the main inputs to produce the final map.


Related Paper and data:

Wednesday, April 9, 2014

Rise in Transport Costs in Brazil

In June 2013, the rise in Bus fares were the spark for huge protests in more than 80 cities in BrazilIn this report (published in Portuguese last year) we analyze some of the main pricing and funding issues of public transport in Brazil. The rise in transport costs in the country is just of them, and in which govermental policies have played an important role subsidizing gasoline consumption and the purchase of new cars.

For more details and a further discussion on this issue, you may read the report here.

And for now, here are some figures and a chart showing the increase in inflation and its transport components between 2000 and 2012 for the largest Brazilian metropolitan areas.

IPCA (Inflation): 125%
Bus fares: 192%
Gasoline: 122%
Owning a vehicle: 44%

[click on the image to enlarge it]

Label Translation:
  • IPCA = consumer price index
  • Tarifa de ônibus = Bus fare
  • Tarifa de Metro = Subway fare
  • Gasolia = Gasoline
  • Veículo próprio = Owning a vehicle (car or motocycle), including purchase and maintenance expenses.

Saturday, January 4, 2014

Delineating Geographical Regions with telephone call networks

An interesting paper discussing the delimitation of geographical regions and community boundaries, by Michael Szell and colleagues. This study can bring useful insights to the debate on functional urban areas and on the definition of metropolitan boundaries.


Sobolevsky S et al. (2013) Delineating Geographical Regions with Networks of Human Interactions in an Extensive Set of Countries. PLoS ONE 8(12): e81707. doi:10.1371/journal.pone.0081707

Abstract:


Large-scale networks of human interaction, in particular country-wide telephone call networks, can be used to redraw geographical maps by applying algorithms of topological community detection. The geographic projections of the emerging areas in a few recent studies on single regions have been suggested to share two distinct properties: first, they are cohesive, and second, they tend to closely follow socio-economic boundaries and are similar to existing political regions in size and number. Here we use an extended set of countries and clustering indices to quantify overlaps, providing ample additional evidence for these observations using phone data from countries of various scales across Europe, Asia, and Africa: France, the UK, Italy, Belgium, Portugal, Saudi Arabia, and Ivory Coast. In our analysis we use the known approach of partitioning country-wide networks, and an additional iterative partitioning of each of the first level communities into sub-communities, revealing that cohesiveness and matching of official regions can also be observed on a second level if spatial resolution of the data is high enough. The method has possible policy implications on the definition of the borderlines and sizes of administrative regions.


[image credit: Sobolevsky S et al., 2013]

Sunday, August 4, 2013

The Urban Observatory

The founders of ESRI and TED have created a new project called The Urban Observatory (I saw this via
Ariel Schwartz). It's an interactive platform that allows you to visualize and compare many world cities regarding some of their key statistics (population density, urban footprint, land use, senior population etc).


One strong point of this project is to use standardized comparative data. Besides, the platform is very easy to use. It's a great way to spend your time  if you have any  playing with maps. But that's it. The data displayed on the website are not available for download, at least up until now. Moreover, it looks there are still some MAUP issues to be addressed by the project team. I'm sure these limitations will be overcome as the project develops further.

Howsoever, it is a great initiative. You should take a look.

Friday, November 30, 2012

Brazil's Largest Metropolitan Economies

The Brookings Institute has just published some economic snapshots of Brazil's largest metro areas (which 'rank among the world’s 300 largest metropolitan economies'). All profiles are available in English and in Brazilian Portuguese.


Related Link: The top metropolitan economy in the world in 2012 (Interactive)

Soundtrack: stutterer in love (1931)

Monday, November 26, 2012

The Richest Cities in the US in 1978 and Now

A study by McKinsey Global Institute showing the richest metros in the US in 1978 and now (via Jordan Weissmann).

[Click on the image to enlarge it]

Tuesday, September 25, 2012

Land Regulation in Brazilian Cities

It is somewhat difficult to find academic studies about Brazilian cities published in English. So here are some interesting papers I would recommend on Land Regulations in Brazilian Cities.
  1. Avila (2006) Urban Land Use Regulations in Brazilian Cities - Impacts on Urban Land Markets and Access of Low Income People to Land and Housing. This chapter starts only at page 216, buthe book as a whole is highly recommended!

  2. LallWang; da Mata (2006) Do Urban Land Regulations Influence Slum Formation? Evidence from Brazilian Cities (I saw this paper on Richard K. Green's blog)

  3. Smith; Raemaekers (1998) Land use pattern and transport in Curitiba

  4. Dowall; Monkkonen (2007) Consequences of the Plano Piloto: The Urban Development and Land Markets of Brasília (you may access the working paper version here)

If you have any other suggestions, let us know with a comment !

Thursday, June 28, 2012

BRIC's population in US metros

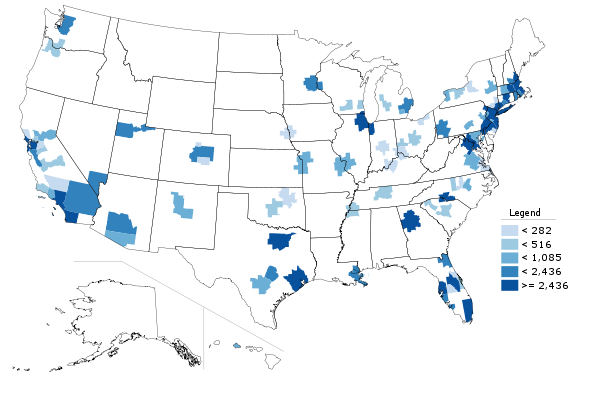
Aaron (Urbanophile) has done this analysis showing how many Brazilians, Russians, Indians and Chinese are living in US metropolitan areas. We are not as many as I thought and we are by far fewer when compared to other BRIC countries. Click here to take a closer look.

Total Brazil born population by metro (2010)
[image credit: Urbanophile]

Soundtrack: Tim Maia

Wednesday, April 4, 2012

Wednesday, January 18, 2012

2011 Global MetroMonitor

The Brookings Institute recently released their 2011 Global MetroMonitor, which analyses the economic growth in the world’s 200 largest metropolitan economies (including five Brazilian metropolitan areas).

It looks pretty interesting. For instance, "ninety percent of the fastest-growing metropolitan economies among the 200 largest worldwide were located outside North America and Western Europe". More here and here

View the interactive map for economic statistics on individual metro areas


soundtrack: que pena

Tuesday, May 3, 2011

Assorted Links - Booming Metropolis


#12 Rio de Janeiro
#3 Mexico City
#2 São Paulo
#1 London

  • Urban World: Mapping The Economic Power Of Cities - a not
    not so new
    report from the McKinsey Global Institute explores 600 urban centers over the next 15 years15 years. "[...] the center of gravity of the urban world will move south and, even more decisively, east (thanks Waldery Rodrigues Junior for the tip)


Monday, November 22, 2010

Demographic trends shaping US metropolitan areas


This is a video report by the Brookings Institution on the demographic trends that have affected US metropolitan areas in the 2000s. The study focuses on the metro scale and stresses five demographic trends that are currently undergoing in the US:

  1. Growing fast
  2. Diversifying rapidly
  3. Aging Tsunami
  4. Selectively educating
  5. Divided by income

The video is realy good and the Full Report looks even better. "The State of Metropolitan America: on the front lines of demographic transformation" Download it here.

ps. You can also explore data for the US 100 metro areas and 50 states (State of Metropolitan America Indicator Map).

ps2. I wonder when we are going to see a report like this on Brazil Demographics...