Tuesday, July 29, 2014

Brazil as seen from the ISS

"Early morning of June 12 2014, one of the Expedition 40 crew members aboard the International Space Station (ISS) took this picture of Brazil ... Sao Paulo is the large cluster of night lights near the coast on the right side of the frame. Rio de Janeiro is the coastal city to the left of Sao Paulo. Belo Horizonte is the cluster of lights near frame center." 

An amazing picture by Reid Wiseman (via Demografía - CSIC).

[click on the image to enlarge it]


Related Links:

Monday, July 28, 2014

Journeys to Work in the UK

James Cheshire and Oliver O’Brien alert us that the UK Office for National Statistics (ONS) have released the Travel to Work Flows based on the 2011 census. James and Oliver have also developed a nice interactive map you can "play" with: Commute.DataShineRob Fry also calls attention to another great interactive visualization here, by ONS.


[image credit: James Cheshire and Oliver O’Brien]


Thursday, July 24, 2014

Are speed cameras Effective?

 kind of off-topic 

If this paper cannot convince you that speed cameras are effective in reducing road traffic collisions, you should watch this video. It gets really good at 1:12.


Population distribution in European capitals


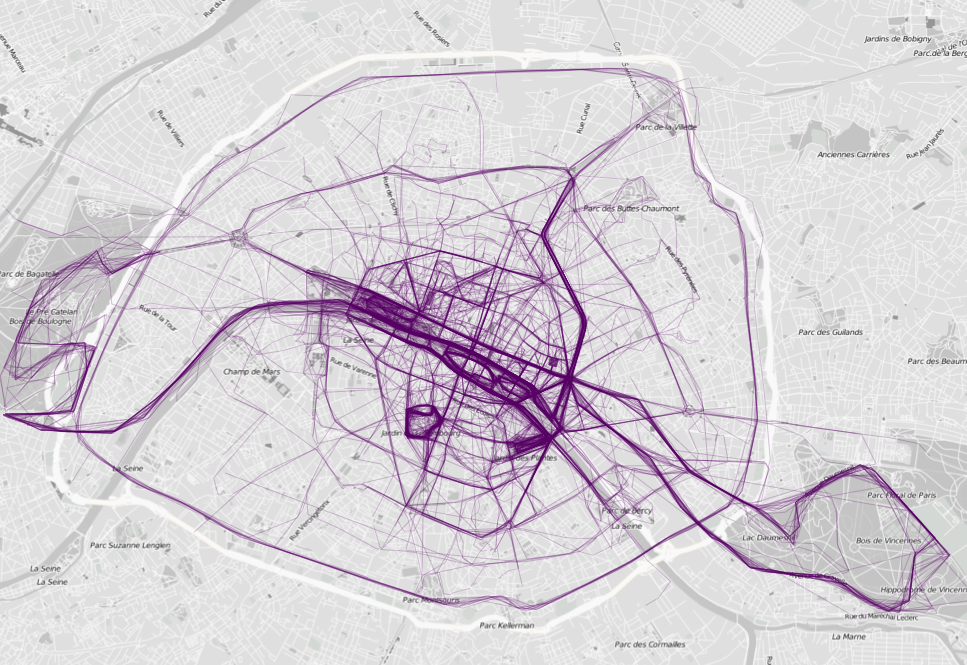
The map shows a fine-scale spatial population distribution in selected European capitals. The high resolution map is here, and it comes from this paper:


Batista e Silva, F., Gallego, J., Lavalle C. (2013). A high-resolution population grid map for Europe. Journal of Maps 9(1):16-28.

Abstract:
Population figures are usually collected by national statistical institutes at small enumeration units (e.g. census tracts or building units). However, still for many countries in Europe, data are distributed at coarser geographical units like municipalities. This level of resolution is insufficient for analysis in many fields. In addition, the heterogeneity of the size of the geographical units causes great distortions in analysis, i.e. the Modifiable Areal Unit Problem (MAUP). Dasymetric mapping techniques have long been applied world-wide to derive finer (and MAUP-free) depictions of the population distribution. These techniques disaggregate population figures reported at coarse source zones into a finer set of zones using ancillary geographical data. ... In this article, we test new geographical datasets to produce an updated and improved European population grid map. ... As final outcome of this cartographic exercise, a European population grid map for the reference year of 2006, with a spatial resolution of 100 × 100 meters, is presented and validated against reference data. Resident population reported at commune level, a refined version of CLC and information on the soil sealing degree are used as the main inputs to produce the final map.


Related Paper and data:

Sunday, July 20, 2014

Winter Course on Advanced Studies in Demography at MPIDR


The Max Planck Institute for Demographic Research (MPIDR) is receiving applications for the upcoming International Advanced Studies in Demography (IDEM) program, next winter semester 2014/15 in Rostock (Germany).

The program includes courses on Agent-based Modeling and Simulation, Integral Projection Models, Bayesian Forecasting, Spatial Demography, and other topics. Highly recommended! Thanks Rob Salguero-Gomez for the tip.

Saturday, July 19, 2014

Wednesday, July 16, 2014

Old and New Isochrone Maps

Apparently, this is one of the oldest isochrone maps, circa 1920. It shows the “minimum” travel time into the city of Melbourne via suburban railways and tram lines (via Daniel Bowen and Transit Maps).

 Transit Maps also points out to this isochrone map of Manchester in 1914.  Finally, the Atlas of the Historical Geography of the US of 1932 showed also published a few isochrone maps of American railways in the 1800s. These maps comprise only a small sample of our old obsession with time.

Train and Tram Travel Times in Melbourne, Australia, c. 1920


More recently, some people/projects have been applying new technologies to this old obsession with travel times, and the results include some pretty amazing maps. Among many of these new projects, I would highlight two:  The great Mapnificent (by Stefan Wehrmeyer).


Ant the amazing work Xiaoji Chen and her maps of Singapore and the isogreenic (!) map of Paris


Related Links

Friday, July 11, 2014

Happy World Population Day

Half the world's population live in the six countries, via Conrad Hackett


And a related  already 'old'  map: More than half of humanity lives within this circle


ps. Looking at these two maps side by side, however, make me a bit suspicious about them...

Thursday, July 10, 2014

Urban Picture

Dubai, by Terence S. Jones


[click on the image to enlarge it]

Monday, July 7, 2014

How we move in cities

A short post about a few great visualizations of how we move in cities*:

Mark Byrnes writes about the iPhone app Human, that has already tracked 7.5 million miles traveled by their users using different transport modes in 30 different cities.


Nathan Yau also point out to two mobile apps that collect data about where people run and bike in major cities: RunKeeper  and Strava.


* There are many other projects dedicated to capture human mobility patterns in our cities using a wide variety of data sources and visualization techniques. It would be barely impossible to cover all of them. Here is a list with some of the projects I have crossed with: 

Normal and Paranormal distributions

Isn't it a brilliant paper?

Freeman, M. (2006). A visual comparison of normal and paranormal distributions. Journal of Epidemiology and Community Health, 60(1), 6.


Friday, July 4, 2014

Does anyone actually read your research?

The World Bank have asked themselves this question and here is what they found: almost 87 percent of  their policy reports were never cited (ht Patricia Morita Sakowski).

If you're, like me too lazy  busy to read the WB report, you can check Christopher Ingraham's piece in the Washington Post.
Nearly one-third of their PDF reports had never been downloaded, not even once. Another 40 percent of their reports had been downloaded fewer than 100 times. Only 13 percent had seen more than 250 downloads in their lifetimes. Since most World Bank reports have a stated objective of informing public debate or government policy, this seems like a pretty lousy track record.

ps. If you would like to track your own citations, you could subscribe to Google Scholar Citations.

Tuesday, July 1, 2014

NYC Taxi Trips Data from 2013

A while ago, we have pointed out to some data visualization of taxi trips in New York. Recently, Chris Whong and Andrés Monroy got access to a copy of the taxi records from 2013 and published them on the web. You may download the data here (ht Bernardo Furtado).

And you may also play a little with this great visualization of the data created by Eric Fischer (@enf).


For a more theoretical discussion, take a look at this post by Daniel Brownstein: Cabstopping: Data Visualization and the Re-Mapping of Urban Space