Monday, October 30, 2017

Transport legacy of mega-events, equity and the future of public transport in Rio de Janeiro

Just a quick update of my PhD.

A few months ago I was awarded the Lee Schipper Memorial Scholarship, by the WRI Ross Center for Sustainable Cities. This award was established in 2012 to celebrate Lee Schipper, who was one of the founders of EMBARQ and an enthusiastic supporter of building closer links between rigorous research and policy-making.

Thanks to this award and the support from TSU/Oxford University and the Institute for Applied Economic Research (Ipea), I was able to put together a seminar to promote a discussion among researchers, civil society and public authorities about the transport legacy of mega-events, equity and the future of urban mobility in Rio de Janeiro. The event is going to be held at Ipea in Rio de Janeiro next Monday (Nov. 6). The full program of the event is available here [in Portuguese]. Come by if you're in town!

This seminar is in a way a byproduct of my doctoral research. Alongside other speakers, I will be presenting at the event some of the results from two papers from my PhD. In these studies I analyze how the transport investments related to mega-events and the subsequent fiscal and economic crisis in Rio affected the provision of public transport services between 2014 and 2017. In different ways, both papers engage with a wider discussion on how transport policies can transform the fabric of cities and reshape social and spatial inequalities in access to opportunities. Both papers are currently under review, but if you're really looking for a reason to procrastinate you can read their pre-prints in the links below:

  • One of the papers reflects on the delimitation of transport legacies and analyzes how recent transport developments in Rio increased the number of people from different income levels who could access Olympic sports venues and healthcare facilities by public transport within 15, 30, 60 and 90 minutes.
  • The other paper uses spatial regression models and cluster analysis to evaluate in multiple spatial scales how gains in accessibility to jobs and schools varied across different income groups and areas of the city as a result of the recent policies adopted in Rio.


Friday, October 27, 2017

Converting GTFS data into an igraph for network analysis in R

It is becoming ever more common for local transport authorities to publish their data on public transport networks in GTFS format. Two of the advantages of so many agencies using a standardized data format is that it makes it easier for us (1) to apply the same research methods to different cities and do comparative studies, and (2) to share our scripts, get feedback and learn from others. 

While working on my PhD on transportation equity in Rio de Janeiro, I have written a script in R that converts GTFS data into an igraph so I can run some network analysis. I shared this script on GitHub yesterday and it got the attention of a few people on Twitter, so I thought some of you might be interested as well. Get in touch if you would like to share any feedback or do some collaboration. :)


Thursday, October 26, 2017

Monday, October 23, 2017

Quote of they day: programming


"In programming the hard part isn’t solving problems, but deciding what problems to solve."

ps. a timely quote that reflects my struggle working on the 4th paper of my doctoral research.

Tuesday, October 17, 2017

Migrating researchers are cited the most

This is according to a recent paper published in Nature. The authors analyzed 14 million papers published between 2008 and 2015 by nearly 16 million individual authors. Around 4% of those authors - more than 595K were considered to be “mobile,” meaning they had affiliations with academic institutions in more than one nation between 2008 and 2015. 

The study looks very interesting throughout. Here are only two of the main results:
  • "[...] mobile scholars have about 40% higher citation rates, on average, than non-mobile ones"
  • "Regardless of region, mobility pays in terms of citations. Across all regions, mobile scholars are more highly cited than their non-mobile counterparts. The advantage varies by region. Mobile North Americans see only a 10.8% boost in citations over their non-mobile colleagues. For Eastern European scholars, the gulf is 172.8%."
I thank Tim Schwanen for the pointer.

Monday, October 16, 2017

Two positions open at Oxford

Just a heads up to job seekers. There are currently two positions open at Oxford University. Perhaps some of you could be interested.

Thursday, October 12, 2017

Tuesday, October 10, 2017

Insights from behavioural economics into transport planning and design

Yesterday, Richard Thaler was awarded the 2017 Prize in Economic Sciences "for his contributions to behavioural economics". In case you're interested on the topic, Erel Avineri has published a paper a few years ago where he discusses some of the insights that research in behavioural sciences can bring into the planning and design of transport systems to make them safer, sustainable and more efficient.

Avineri, E. (2012). On the use and potential of behavioural economics from the perspective of transport and climate change. Journal of Transport Geography, 24, 512-521.

Abstract:
It can be argued that the main thinking in transport planning and policy making stem from neoclassical economics in which individuals are largely assumed to make rational, consistent, and efficient choices, and apply cognitive processes of decision making that maximise their economic utility. Research in behavioural sciences indicates that individuals’ choices in a wide range of contexts deviate from the predictions of the rational man paradigm inspired the research agenda in the field of travel behaviour. New concepts and practices of government aim to apply some behavioural economics insights in the design of behavioural change initiatives and measures, an approach recently advocated in the US and the UK. This paper provides a brief review on the use and potential of behavioural economics from the perspective of transport and climate change, in two main contexts: travel demand modelling and design of behaviour change measures. The discussion of limitations and knowledge gaps associated with the implementation of behavioural economics to a travel behaviour context might contribute to the debate and help in defining research agenda in this area.

Monday, October 9, 2017

Why you should always visualize your data

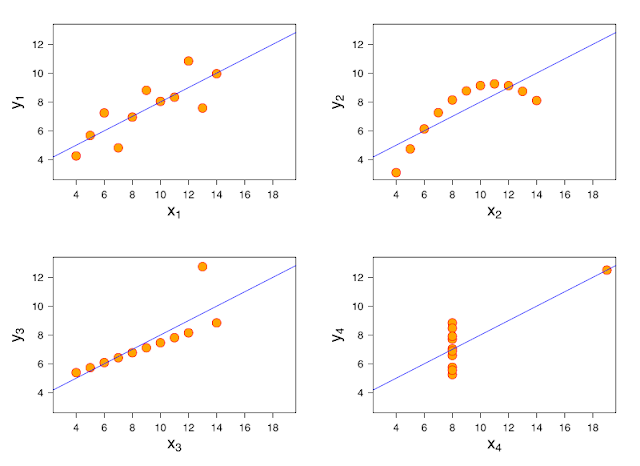
In 1973, the statistician Francis Anscombe published a paper demonstrating the importance of plotting the data before analyzing it. That paper introduced what latter became known as the Anscombe's Quartet, which comprises four datasets that have almost identical descriptive statistics including means, variances and correlation and yet look completely different when you plot them.

This is how the Anscombe's Quartet look like.


This year, this idea has been taken to a whole new level. A couple of researchers took this idea very seriously and they developed a method to relocate the points in a scatterplot towards a given shape and still keep descriptive summaries seemingly identical. The authors published the method here. They've also developed an R library {datasauRus} so you can   procrastinate the whole afternoon  learn more about statistics.


Tuesday, October 3, 2017

The long-term effect of slavery on inequality today

According to a new working paper, 1800s slavery explains approximately 20% of income inequality in Brazil today. While the direction of the impact is not surprising, I'm impressed by its magnitude. I wonder how much investment in cash transfer programs would be necessary to achieve an effect of similar magnitude. Thanks John B. Holbein‏ for pointing to this study on Twitter.


Fujiwara, T., Laudares, H., & Caicedo, F. V. (2017). Tordesillas, Slavery and the Origins of Brazilian Inequality.

From the abstract:
"...To deal with the endogeneity of slavery placing, we use a spatial Regression Discontinuity framework, exploiting the colonial boundaries between the Portuguese and Spanish empires in current day Brazil. We find that the number of slaves in 1872 is discontinuously higher in the Portuguese side of the border, consistent with this power’s comparative advantage in this trade. We then show how this differential slave rate has led to higher income inequality of 0.103 points (Gini coefficient), approximately 20% of average income inequality in Brazil. To further investigate the role of slavery on economic development, we use the division of the Portuguese colony into Donatary Captancies. We find that a 1% increase in slavery in 1872 leads to an increase in inequality of 0.112. Aside from the general effect on inequality, we find that more slave intensive areas have higher income and educational racial imbalances and worse public institutions today"

ps. This paper also reminds me of this post on how presidential elections are impacted by a 100 million year old coastline in the USA. Hint: geology determined the distribution of productive land, which influenced the spatial distribution of African slaves which in turn influenced the electoral distribution. I'm not saying I'm convinced by this argument but I have to recognize it uses a quite inventive identification strategy.
image credit: Fujiwara et al (2017)

Sunday, October 1, 2017

Our biggest cities have existed and died before

Ta-Prohm, Cambodia, used to be the largest population settlement before the industrial revolution. Nowadays it is one of the most impressive ruins in the world.

"In reality, our biggest cities have existed and died before. This one did. It just happens over a longer period of time - the rain falls, the roots grow and nature eats what we built. The best technology of that time wasn't enough." Geat video by Joe Posner (Vox)