- Using R to model spatial patterns of urban growth in Africa
- Great 'course' on network visualization with R, by Katherine Ognyanova
- Building a Schelling segregation model in R, by Ben Davies
- Basic mapping and attribute joins in R, by Robin Lovelace
- A shiny app to explore the demographics of Texas counties, by Kyle Walker
- Nathan Yau compares ggplot2 and R Base Graphics
- A Compendium of Clean Graphs in R
- I've gathered some code to show how to create Flow maps in R using ggplot2
Structured Procrastination on Cities, Transport Policy, Spatial Analysis, Demography, R
Showing posts with label Modelling. Show all posts
Sunday, March 27, 2016
R Links
Marcadores:
Coding,
Modelling,
Network,
R,
Urban Evolution,
visualizing complexity
Wednesday, September 9, 2015
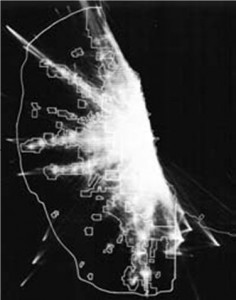
Returners and explorers dichotomy in human mobility
Pappalardo, L., Simini, F., Pedreschi, D., Barabasi, L. et al. (2015). Returners and explorers dichotomy in human mobility. Nature Communications, 6. doi:10.1038/ncomms9166
Abstract:
The availability of massive digital traces of human whereabouts has offered a series of novel insights on the quantitative patterns characterizing human mobility. In particular, numerous recent studies have lead to an unexpected consensus: the considerable variability in the characteristic travelled distance of individuals coexists with a high degree of predictability of their future locations. Here we shed light on this surprising coexistence by systematically investigating the impact of recurrent mobility on the characteristic distance travelled by individuals. Using both mobile phone and GPS data, we discover the existence of two distinct classes of individuals: returners and explorers. As existing models of human mobility cannot explain the existence of these two classes, we develop more realistic models able to capture the empirical findings. Finally, we show that returners and explorers play a distinct quantifiable role in spreading phenomena and that a correlation exists between their mobility patterns and social interactions.
[image credit: Pappalardo et al. 2015]
Marcadores:
Modelling,
Transport,
travel behavior
Sunday, June 14, 2015
Friday, February 20, 2015
An Agent-Based Simulation of the Urban Growth in Latin American cities
Barros, Joana (2012). Exploring urban dynamics in Latin American cities using an agent-based simulation approach. In Agent-based models of geographical systems (pp. 571-589). Springer Netherlands. [Ungated version here, and PhD Thesis here]
Abstract:
This paper focuses on a specific kind of urban growth that happens in Latin American cities, called 'Peripherisation'. This is characterised by the formation of low-income residential areas in the peripheral ring of the city and a perpetuation of a dynamic core-periphery spatial pattern. The dynamics of growth and change in Latin American cities are explored using agent-based simulation. The objective is to increase the understanding of urban spatial phenomena in Latin American cities, which is essential to providing a basis for future planning actions and policies. Simulation exercises were used to revisit assumptions about urbanisation issues in Latin American cities and investigate important aspects of growth and change in these cities. These exercises allowed the problem of urban growth in Latin American cities to be unfolded through their dynamics, relating these dynamics to urban morphology, and thus presenting a new and important perspective on the phenomenon.
Marcadores:
Density,
Modelling,
Morphology,
Urban Evolution,
Urban Sprawl
Friday, January 16, 2015
Sometimes, the size of your data matters
off-topic post:
The Millennium Simulation Project is a simulation of the large-scale evolution of the Universe from just after the big bang to the present:
The Millennium Run modelled more than 10 billion particles to trace the evolution of the matter distribution in a cubic region of the Universe over 2 billion light-years on a side. It kept busy the principal supercomputer at the Max Planck Society's Supercomputing Centre in Garching, Germany for more than a month.
Related links to remind us how uninportant we are:
Thursday, November 20, 2014
NASA's high-resolution computer model of CO2 emission
A couple of weeks ago, we wrote a short post about NASA's project to monitor Urban Greenhouse Gas Emissions from Space using a new satellite, the Orbiting Carbon Observatory-2 (OCO-2).
NASA has recently released a new stunning animation using the results of a high-resolution computer model of CO2 emissions on Earth's atmosphere'. (HT Franziska Gaupp, who is working with drought modeling and food supply here at Oxford)
Marcadores:
environment,
Modelling,
Video,
visualizing complexity
Thursday, September 18, 2014
Solving the Traveling Salesman Problem with R
Given a list of places you want to go, what is the shortest possible route that visits each place and returns to the place where you first started? This is the basic idea behind the Travelling Salesman Problem (TSP).
Most of us have faced this problem before, either when planning a trip with many cities/tourist attractions, or maybe when dealing with more complex stuff like optimizing public transport systems, air line operations, shipping routes etc. Computationally speaking, this used to be a difficult problem, but things are changing and the number of programs to solve the TSP is increasing.
Todd W. Schneider has created a brilliant code to build interactive solutions to the Traveling Salesman Problem using R and Shiny . In this post here, you may read in detail how the simulation process works and you may also play trying to find the shortest route through some world cities or through all of the US State capitals. (ht Tariq Khokhar).
[image credit: Todd W. Schneider]
Tuesday, April 29, 2014
Recreating a City from Google Street Map
Patricio Gonzalez Vivo does an amazing work by Scraping Google Street View depth data and reconstructing it with openFrameworks to buil a digital city. This is the kind of stuff that makes me like the future more than I like the past.
Marcadores:
Modelling,
Video,
visualizing complexity
Wednesday, March 26, 2014
Monday, December 9, 2013
Urban Modelling back in 1976
The other day I was wandering in the library when I bumped into the book Urban Modelling: Algorithms, Calibrations, Predictions, published by M. Batty back in 1976 (!). Since then, he and his team at CASA have made many contributions to the field of urban studies with new modelling developments and applications.
Some of the softwares developed at CASA (including GMap Creator) are available for download here. You can play with your own Von Thunen Model!
[Image Credit: CASA]
Related Links:
Marcadores:
GIS,
Modelling,
Morphology
Wednesday, November 7, 2012
A cellular automata intraurban model with prices and income-differentiated actors
Bernardo A. Furtado (a friend of mine from Ipea) have recently published this paper that I'd like to share with you:
A cellular automata intraurban model with prices and income-differentiated actors
Environment and Planning B: Planning and Design 39(5) 897 – 924
Abstract:
A cellular automata intraurban model with prices and income-differentiated actors
Environment and Planning B: Planning and Design 39(5) 897 – 924
Abstract:
This paper presents an intraurban cellular automata model that is an extension to White and Engelen’s pioneering model. The paper’s main contribution is to distinguish between agglomerative effects, determined by the attraction of the neighbourhood, and disagglomerative effects, driven by land prices, or land affordability. In order to do that, social heterogeneity is introduced in the model at the intraurban level. As a result, we can simulate both the evolution of land use and land prices. An application of the model and a sensitivity analysis indicate that neighborhood influence is the main driving force of cities’ spatial configurations. Prices, however, exert an important countereffect. Actually, the higher the influence of land prices, the faster land succession is observed. Finally, an important conclusion of the model is that intraurban models should not fail to differentiate actors by income level.
Evolution of actors in the Metropolitan Region of Belo Horizonte (Brazil), 1900-2000
[Image Credit: Furtado et al (2012) ]
Label:
Related Links:
Marcadores:
GIS,
Ipea,
Modelling,
Prata da Casa,
Urban Evolution
Sunday, October 28, 2012
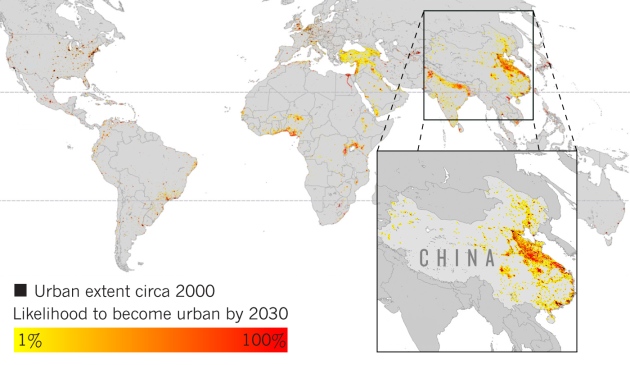
Global forecasts of urban expansion
A cutting edge study by Karen C. Seto (Yale) and others on urban growth projections around the world and some of its environmental impacts (via Urbanization Project). Read a briefing of the study here or here.
Abstract:
"[...] despite projections that world urban populations will increase to nearly 5 billion by 2030, little is known about future locations, magnitudes, and rates of urban expansion. Here we develop spatially explicit probabilistic forecasts of global urban land-cover change and explore the direct impacts on biodiversity hotspots and tropical carbon biomass. If current trends in population density continue and all areas with high probabilities of urban expansion undergo change, then by 2030, urban land cover will increase by 1.2 million km2, nearly tripling the global urban land area circa 2000."
Marcadores:
environment,
GIS,
Modelling,
Projections,
Urban Evolution,
Urban Sprawl,
Urbanization,
World Population
Tuesday, October 23, 2012
Assorted Links
- Brazil’s housing market
- IMO report: Rutas y dinámicas migratorias entre los países de América Latina y el Caribe (ALC), y entre ALC y la Unión Europea
- Why Has Regional Convergence in the U.S. Stopped? (paper here)
- Incarceration elevates early infant mortality risk (via MR)
- Eurostat Regional Yearbook 2012 - Interactive atlas here
- Infant Mortality in Brazil, 1980-2000: A spatial panel data analysis
- A five-minute talk by Michael Batty on cellular automata modelling
CA Movie from Michael Batty on Vimeo.
Thursday, October 4, 2012
Modelling Cities from 1977
A Old Movie About Modelling Cities from 1977 from Michael Batty on Vimeo.
I thank Joao Meirelles for the pointer.
A Old Movie About Modelling Cities from 1977 from Michael Batty on Vimeo.
I thank Joao Meirelles for the pointer.
A Old Movie About Modelling Cities from 1977 from Michael Batty on Vimeo.
Marcadores:
Modelling,
Urban Planning
Sunday, February 26, 2012
Simulations from the Early Days
Michel Batty has gathered some really interesting Early Animations of Urban Models.
One of these videos shows Jack Dangermond (co-founder of Esri) and Allan Schmidt* talking about the 'Harvard Laboratory for Computer Graphics and Spatial Analysis'. (more videos on GIS history here.)
*Allan Schmidt was responsible for what is probably the earliest "movie" of urban expansion. A SYMAP time lapse movie depicting growth of Lansing, MI 1850-1965.
If you are unpatient to see it, skip to 3:17 or just click here.
Tuesday, June 7, 2011
Cellular automata in your iphone
Now you can have a Cellular Automata (app) model in your iPhone (iPod Touch or iPad). It's the SPEED Sim (aka Spatial Population Ecological and Epidemiological Dynamics Simulator).
Dr. David Hiebeler and his team at the SPEED Lab (Spatial Population Ecological and Epidemiological Dynamics Lab) developed this app that allows you to explore the dynamics of three spatial simulation models.
- Dispersal 2: Population model with local dispersal at distance 1 or 2, and long-distance dispersal.
- SIRS: Spatial epidemiological model.
- Vaccinated communities: Epidemiological model with varying vaccination levels among different communities.
Here you may also access some cellular automata Java applets!
Marcadores:
Modelling
Subscribe to:
Posts (Atom)


+at+Urban+Demographics.gif)