Thursday, May 31, 2018
Should cyclists be forced to wear helmets?
Here is a short summary of the evidence on bike helmets and cycle safety provided by some experts interviewed by the Guardian - HT Rachel Aldred and Phil Maynard.
Tuesday, May 29, 2018
Assorted Links
- Using geolocated tweets and the Google Books datasets to map the Americanization of English in space and time, by Bruno Gonçalves et al.
- Sony World Photography Awards 2018
- Interactive maps with deforestation and reforestation of national parks at the border between Brazil and Argentina, between the 1950s and the 2010s, including some aerial and satellite pictures from US spy satellites from the 1960s. via Frederico Freitas
- Why the New Research on Mobility Matters - via Juan Pablo Chauvin
- Do peoples' judgments on hypothetical trolley dilemmas predict what they would do in a real-life trolley dilemma situation? via Dina Pomeranz
- Meaning of the colors in country flags. The explanation of the Brazilian flag hurts
- Life expectancy vs. health expenditure over time... needless to say the USA has a problem here. via Max Roser et al at Our World in Data

Saturday, May 26, 2018
The creative process lollipop chart
Stefanie Posavec came up with this brilliant 'chart' to illustrate the creative process of coming up with a great idea.

It reminds me of a story of this Brazilian band (Paralamas do Sucesso), when the lead singer/composer was asked about their success. Long time ago a journalist asked him: "When a band releases a new album, they usually get one maybe two songs in the top hits. How come you get so many top hits for every new album you release after so many years on the road?". His secrete, his said, was that every day he would write the lyrics of a new song. It took a lot of discipline, for sure, but at the end of the year he would have more than 300 songs. Most of them would suck, of course, but certainly a few would be good material that could be worked further.
Ok, I don't remember the exact words of the dialogue, but you get the idea. And frankly, I think that's a good advice for young researchers looking for good research questions. Read a lot of papers so you have an informed understanding of what are the knowledge gaps in your field. Then put yourself to ask as many questions as you can think of and write them down without censoring yourself. At some point you will have many questions (20? 50?). Revisit your list of questions after a few weeks and some more reading. You'll realize most of them won't work. Some are too ambitious, some have been answered already, some are just not that relevant etc. Once you have three or four questions that sound reasonably good, it's time to do more reading and to discuss these questions with more experienced mentors/supervisors/friends. Remember to be humble.
"You ask me if I keep a notebook to record my great ideas. I've only ever had one." (Albert Einstein )
The bottom line is this:

credit: Stefanie Posavec
Tuesday, May 22, 2018
Using deep learning and satellite imagery to improve land use classification in cities
Marta Gonzalez and colleagues have a recent paper using deep learning and satellite image data to improve land use classification. The authors have made documented code and Jupyter notebooks available here. I'm self recommitting the paper and code to my future self. HT Marco De Nadai.
Abstact:
Albert, A., Kaur, J., & Gonzalez, M. C. (2017, August). Using convolutional networks and satellite imagery to identify patterns in urban environments at a large scale. In Proceedings of the 23rd ACM SIGKDD International Conference on Knowledge Discovery and Data Mining (pp. 1357-1366). ACM.
Abstact:
Urban planning applications (energy audits, investment, etc.) require an understanding of built infrastructure and its environment, i.e., both low-level, physical features (amount of vegetation, building area and geometry etc.), as well as higher-level concepts such as land use classes (which encode expert understanding of socio-economic end uses). This kind of data is expensive and labor-intensive to obtain, which limits its availability (particularly in developing countries). We analyze patterns in land use in urban neighborhoods using large-scale satellite imagery data (which is available worldwide from third-party providers) and state-of-the-art computer vision techniques based on deep convolutional neural networks. For supervision, given the limited availability of standard benchmarks for remote-sensing data, we obtain ground truth land use class labels carefully sampled from open-source surveys, in particular the Urban Atlas land classification dataset of $20$ land use classes across $~300$ European cities. We use this data to train and compare deep architectures which have recently shown good performance on standard computer vision tasks (image classification and segmentation), including on geospatial data. Furthermore, we show that the deep representations extracted from satellite imagery of urban environments can be used to compare neighborhoods across several cities. We make our dataset available for other machine learning researchers to use for remote-sensing applications.
Tuesday, May 15, 2018
Urban Picture
Nova Iguaçu (Brazil). Nova Iguaçu is a municipality in the Metropolitan Area of Rio de Janeiro. The ocean and some of Rio's mountains can be seen in the background of the picture.

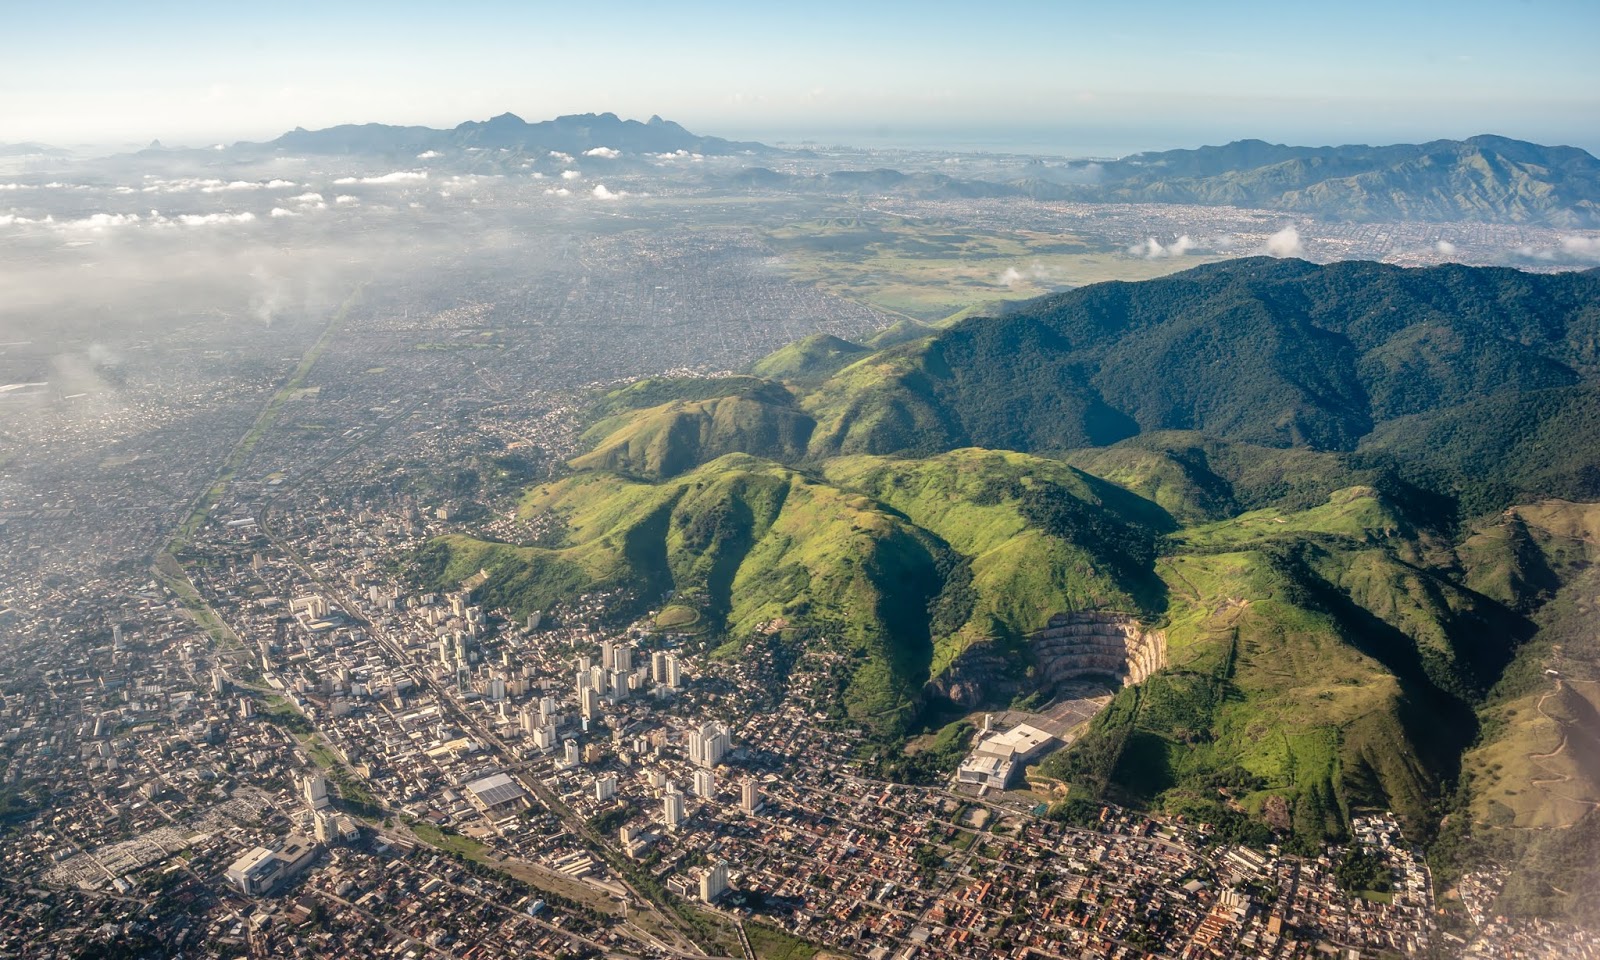
source: vonsenke on reddit, HT Vitor Gabriel
Sunday, May 13, 2018

Tuesday, May 8, 2018
Visualizing space-time networks
I've said this on Twitter before but I should say it here as well. Craig Taylor and the Ito World team have some of the best data visualizations of geospatial data related to cities and transport networks.
Just a few days ago, Craig tweeted some of his latest work with neat visualizations of drive-time network for catchment area analysis. Here is a video comparing different cities in the UK and a brief explanation on how to read the dataviz.
"30 minute drive time analysis from major UK cities visualised as 3d coral geometry.
The thickness of artery is proportional to the number of networks connected to it indicating busier routes. The falloff in height is linked to the proximity to the centre.
Corals aren’t normalised in scale as the purpose of this is visualising the form and pattern the networks create. Animation is a boomerang motion scaling from 0 to 30 min and back again. Congestion/traffic not accounted for."
click at the bottom of the video to watch it in full screen and high definition
Yep, there are some obvious parallels here with Time Geography and in particular with the representation of space-time prisms. The static version of the space-time trees gives a sharper visualization of the data.
The space-time tree, or 3d coral geometry as Craig said.

and the inverted original dataviz, "the drive time web"

Thursday, May 3, 2018
Cities in Brazil: A Law and Economics Research Agenda
Just a few days ago, Edward Glaeser presented at the Harvard Law School Brazilian Association Legal Symposium (video below). Glaeser talked about his recent research and some of the questions it raises towards a research agenda on various challenges faced by cities in Brazil but also in other countries from the developing world. This is a self-recommendation post, I haven't watched the full video yet. Hat tip Bruno Bodart.
ps. curious fact mentioned in the video. Glaeser's PhD thesis advisor at Chicago was the Brazilian economist José Scheinkman.
Subscribe to:
Posts (Atom)