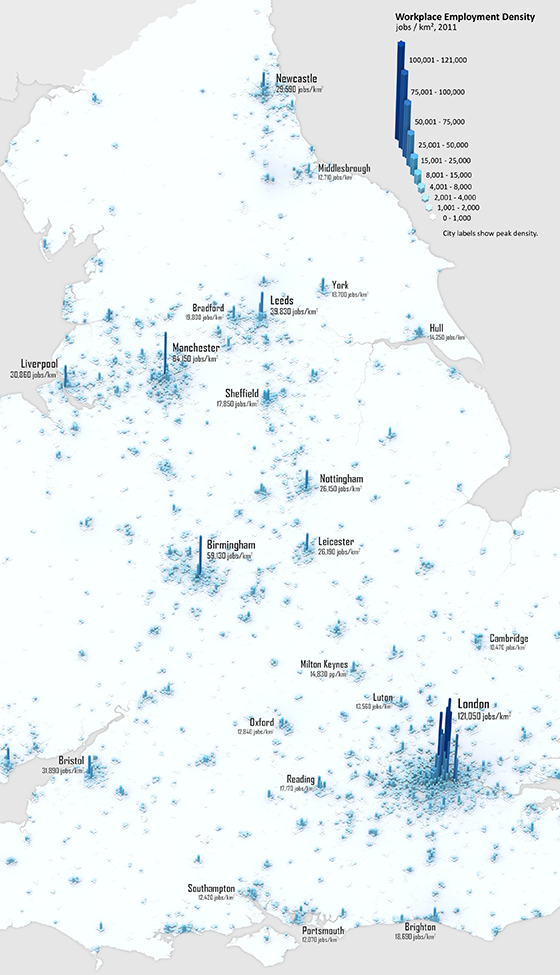
If you didn't have internet connection during 2014, you might have missed some of the buzz around LuminoCity 3D (more info here). This is probably the best interactive tool for visualizing and exploring the 2011 Census data of the UK*.
It brings data from a wide range of topics. For example, it makes it possible to visualize urban growth, analyze household energy use or compare living and working densities in cities across England and Wales, etc.
LuminoCity 3D is a project by Duncan A.Smith (CASA/UCL), who also runs the great blog 'City Geographics'. obs. It is such a great project that I fill a bit embarrassed that I'm only posting about it now.
Workplace Employment Density, 2011
[click on the image to enlarge it]
[image credit: Duncan Smith]
Journey-to-work flows
[image credit: Duncan Smith]
