obs. Alasdair and Topi have worked in many other great projects and they are extremely generous, often sharing their data and code openly. These two are definitely worth following on Twitter.
Very interesting paper on the intersection of economic geography, development and transport economics. From a quick glance at the paper, I believe it could probably bring some interesting insights into network science as well.
We study the impact of international long-distance flights on the global spatial allocation of economic activity. To identify causal effects, we exploit variation due to regulatory and technological constraints which give rise to a discontinuity in connectedness between cities at a distance of 6,000 miles. We show that improving an airport’s position in the network of air links has a positive effect on local economic activity, as captured by satellite-measured night lights. We find that air links increase business links, showing that the movement of people fosters the movement of capital. In particular, this is driven mostly by capital flowing from high-income to middle-income (but not low-income) countries. Taken together, our results suggest that increasing interconnectedness induces links between businesses and generates economic activity at the local level, but also gives rise to increased spatial inequality locally, and potentially globally.
ps. The authors are also on Twitter in case you would like to follow their work more closely. Campante, F., & Yanagizawa-Drott
The transition from more than 6 to fewer than 3 children per woman took the UK almost a century. This change took 26 years to happen in Brazil, and only 11 years in China - Max Roser (ht Leo Monasterio)
The brute luck of being born in a poor or wealthy family has a tremendous influence on a person's educational performance. One of the most important factors that shape our future life chances is something over which we had no choice whatsoever https://t.co/DgMYSTbabK
This Special Issue aims at collecting both novel research and reviews on Public Policy Modeling and Applications, showing not only the cross-disciplinary nature of the field but also how rigorous scientific studies have already contributed towards understanding the complexity of social systems and to policy making.
Potential topics include but are not limited to the following:
Complex social systems and applications in public policy
Complexity methods and analysis for policymakers
The effects of governance in complex social systems
Management of financial networks, real estate, and financing spillovers
Smart cities, mobility, and flows in complex urban environments
Dynamic risk management in complex scenarios
Analyses that explicitly include political-spatial governance boundaries
Design and analysis of complex sociotechnical systems for public services
Timnit Gebru and her colleagues have recently published a very interesting paper in PNAS. The authors developed a method to analyze car images from Google Street View using machine-learning and computer vision methods to determine socioeconomic statistics and political preferences at the zip code level in the US. There is a video of Timnit Gebru presenting the paper here.
The United States spends more than $250 million each year on the American Community Survey (ACS), a labor-intensive door-to-door study that measures statistics relating to race, gender, education, occupation, unemployment, and other demographic factors. Although a comprehensive source of data, the lag between demographic changes and their appearance in the ACS can exceed several years. As digital imagery becomes ubiquitous and machine vision techniques improve, automated data analysis may become an increasingly practical supplement to the ACS. Here, we present a method that estimates socioeconomic characteristics of regions spanning 200 US cities by using 50 million images of street scenes gathered with Google Street View cars. Using deep learning-based computer vision techniques, we determined the make, model, and year of all motor vehicles encountered in particular neighborhoods. Data from this census of motor vehicles, which enumerated 22 million automobiles in total (8% of all automobiles in the United States), were used to accurately estimate income, race, education, and voting patterns at the zip code and precinct level. (The average US precinct contains ∼∼1,000 people.) The resulting associations are surprisingly simple and powerful. For instance, if the number of sedans encountered during a drive through a city is higher than the number of pickup trucks, the city is likely to vote for a Democrat during the next presidential election (88% chance); otherwise, it is likely to vote Republican (82%). Our results suggest that automated systems for monitoring demographics may effectively complement labor-intensive approaches, with the potential to measure demographics with fine spatial resolution, in close to real time.
cities used to train a model estimating socioeconomic data from car attributes
A couple of weeks ago, I organized the seminar "Transport legacy of mega-events, equity and the future of public transport in Rio de Janeiro", which was held at the Institute for Applied Economic Research (Ipea) in Rio de Janeiro. The seminar generated some interesting discussions on issues of equity, transport planning and uneven urban development in Rio. It also contributed in bringing together academic researchers, organizations from the civil society and policy makers directly involved with the transport and urban planning of Rio in different governmental levels (municipality and metropolitan area).
The seminar was recorded and the videos are now available on Ipea's Youtube channel. Apart from session 2, all presentations were in Portuguese.
In this session, three speakers including myself presented some of their recent work assessing the equity impacts of transport legacy of mega-events in Rio de Janeiro.
While the presentations in the 1st session focused on the role of governmental policies in delivering just transport policies and investments, the second session emphasized the role of community organization and self-management in promoting more just and inclusive transport systems despite of the government.
In the the third session, academics and policy makers heavily involved in the transport planning of Rio municipality and metropolitan area reflected about some of the issues addressed in the previous sessions and the challenged involved in the transport planning of Rio.
The event gathering a good audience (aprox. 70 people) and it received attention from national and local TV channels and newspapers. If you don't have time to watch the entire seminar, these four pieces give a good summary of the discussions:
The event will be held on Wednesday 15th November, from 17-19 at St. Antony’s College (Panel discussion: 17:00-18:30, Nissan Lecture Theatre. sorry for the late post
This chart below was created by Brittany Mayes and Matthew Zhang for the NPR piece, and it is based on data from the Global Health Data Exchange. Thanks Linsey Marr for the pointer on Twitter.
Thanks to this award and the support from TSU/Oxford University and the Institute for Applied Economic Research (Ipea), I was able to put together a seminar to promote a discussion among researchers, civil society and public authorities about the transport legacy of mega-events, equity and the future of urban mobility in Rio de Janeiro. The event is going to be held at Ipea in Rio de Janeiro next Monday (Nov. 6). The full program of the event is available here [in Portuguese]. Come by if you're in town!
This seminar is in a way a byproduct of my doctoral research. Alongside other speakers, I will be presenting at the event some of the results from two papers from my PhD. In these studies I analyze how the transport investments related to mega-events and the subsequent fiscal and economic crisis in Rio affected the provision of public transport services between 2014 and 2017. In different ways, both papers engage with a wider discussion on how transport policies can transform the fabric of cities and reshape social and spatial inequalities in access to opportunities. Both papers are currently under review, but if you're really looking for a reason to procrastinate you can read their pre-prints in the links below:
One of the papers reflects on the delimitation of transport legacies and analyzes how recent transport developments in Rio increased the number of people from different income levels who could access Olympic sports venues and healthcare facilities by public transport within 15, 30, 60 and 90 minutes.
The other paper uses spatial regression models and cluster analysis to evaluate in multiple spatial scales how gains in accessibility to jobs and schools varied across different income groups and areas of the city as a result of the recent policies adopted in Rio.
It is becoming ever more common for local transport authorities to publish their data on public transport networks in GTFS format. Two of the advantages of so many agencies using a standardized data format is that it makes it easier for us (1) to apply the same research methods to different cities and do comparative studies, and (2) to share our scripts, get feedback and learn from others.
While working on my PhD on transportation equity in Rio de Janeiro, I have written a script in R that converts GTFS data into an igraph so I can run some network analysis. I shared this script on GitHub yesterday and it got the attention of a few people on Twitter, so I thought some of you might be interested as well. Get in touch if you would like to share any feedback or do some collaboration. :)
This is according to a recent paper published in Nature. The authors analyzed 14 million papers published between 2008 and 2015 by nearly 16 million individual authors. Around 4% of those authors - more than 595K were considered to be “mobile,” meaning they had affiliations with academic institutions in more than one nation between 2008 and 2015.
The study looks very interesting throughout. Here are only two of the main results:
"[...] mobile scholars have about 40% higher citation rates, on average, than non-mobile ones"
"Regardless of region, mobility pays in terms of citations. Across all regions, mobile scholars are more highly cited than their non-mobile counterparts. The advantage varies by region. Mobile North Americans see only a 10.8% boost in citations over their non-mobile colleagues. For Eastern European scholars, the gulf is 172.8%."
Just a heads up to job seekers. There are currently two positions open at Oxford University. Perhaps some of you could be interested.
Research Associate in Complex Systems Economic Modelling, at the Institute of New Economic Thinking. The researcher will participate in the ‘Sensitive Intervention Points in the Transition to the Post-Carbon Society” project.
Yesterday, Richard Thaler was awarded the 2017 Prize in Economic Sciences "for his contributions to behavioural economics". In case you're interested on the topic, Erel Avineri has published a paper a few years ago where he discusses some of the insights that research in behavioural sciences can bring into the planning and design of transport systems to make them safer, sustainable and more efficient.
It can be argued that the main thinking in transport planning and policy making stem from neoclassical economics in which individuals are largely assumed to make rational, consistent, and efficient choices, and apply cognitive processes of decision making that maximise their economic utility. Research in behavioural sciences indicates that individuals’ choices in a wide range of contexts deviate from the predictions of the rational man paradigm inspired the research agenda in the field of travel behaviour. New concepts and practices of government aim to apply some behavioural economics insights in the design of behavioural change initiatives and measures, an approach recently advocated in the US and the UK. This paper provides a brief review on the use and potential of behavioural economics from the perspective of transport and climate change, in two main contexts: travel demand modelling and design of behaviour change measures. The discussion of limitations and knowledge gaps associated with the implementation of behavioural economics to a travel behaviour context might contribute to the debate and help in defining research agenda in this area.
In 1973, the statistician Francis Anscombe published a paper demonstrating the importance of plotting the data before analyzing it. That paper introduced what latter became known as the Anscombe's Quartet, which comprises four datasets that have almost identical descriptive statistics including means, variances and correlation and yet look completely different when you plot them.
This is how the Anscombe's Quartet look like.
This year, this idea has been taken to a whole new level. A couple of researchers took this idea very seriously and they developed a method to relocate the points in a scatterplot towards a given shape and still keep descriptive summaries seemingly identical. The authors published the method here. They've also developed an R library {datasauRus} so you can procrastinate the whole afternoon learn more about statistics.
According to a new working paper, 1800s slavery explains approximately 20% of income inequality in Brazil today. While the direction of the impact is not surprising, I'm impressed by its magnitude. I wonder how much investment in cash transfer programs would be necessary to achieve an effect of similar magnitude. Thanks John B. Holbein for pointing to this study on Twitter.
"...To deal with the endogeneity of slavery placing, we use a spatial Regression Discontinuity framework, exploiting the colonial boundaries between the Portuguese and Spanish empires in current day Brazil. We find that the number of slaves in 1872 is discontinuously higher in the Portuguese side of the border, consistent with this power’s comparative advantage in this trade. We then show how this differential slave rate has led to higher income inequality of 0.103 points (Gini coefficient), approximately 20% of average income inequality in Brazil. To further investigate the role of slavery on economic development, we use the division of the Portuguese colony into Donatary Captancies. We find that a 1% increase in slavery in 1872 leads to an increase in inequality of 0.112. Aside from the general effect on inequality, we find that more slave intensive areas have higher income and educational racial imbalances and worse public institutions today"
ps. This paper also reminds me of this post on how presidential elections are impacted by a 100 million year old coastline in the USA. Hint: geology determined the distribution of productive land, which influenced the spatial distribution of African slaves which in turn influenced the electoral distribution. I'm not saying I'm convinced by this argument but I have to recognize it uses a quite inventive identification strategy.
Ta-Prohm, Cambodia, used to be the largest population settlement before the industrial revolution. Nowadays it is one of the most impressive ruins in the world.
"In reality, our biggest cities have existed and died before. This one did. It just happens over a longer period of time - the rain falls, the roots grow and nature eats what we built. The best technology of that time wasn't enough." Geat video byJoe Posner (Vox)
This week, it was on the news that Uber will soon lose its license to operate in London since the local transport regulator ruled that Uber is "not fit and proper" to operate in city. This decision is not settled yet and it's probably hopefully going to be negotiated along the appeal process towards a middle-ground regulation.
In the meantime, Tyler Cowen's has shared his views on why this is "a big brexit mistake". This is part of a much larger debate on whether/how governments should regulate the 'sharing economy', a debate which would need a careful discussion on transport regulation. A paper on this very topic just got recently published and it does a really good job at tackling the most important points in this debate. The paper is coauthored by top researchers from the Transport Studies UnitTSU/Oxford I'm biased . This is a very timely discussion in Brazil, where the Congress will be creating a national regulation scheme for ride hailing apps in the coming months (link in Portuguese).
The ride-hailing company Uber has achieved extremely rapid global expansion by means of outmanoeuvring governments, regulators and competitors. The rise of the company has been based on a deliberate strategy of acting as a market disruptive innovator through a user friendly technology and making use of the ‘sharing economy’. These attributes are not unique, but are distinctively augmented by a relentless expansionary ambition and an ability to maintain the capacity to innovate. Uber has generated great political controversy, but the challenge for governments and regulators is to embrace the benefits of the disruptive innovator, while adopting an approach that takes into account the full range of impacts. For Uber, the challenge is to maintain its expansionary style as a disruptive innovator, while also redefining on its terms the political and public debate. The case study of London provides important insights into the dynamics of these processes.
In a 100 million years from now: “Future archaeologists should be able to identify an ‘Urban Stratum’ of fossilized great coastal cities, mostly through the remains of underground infrastructure such as building foundations and utility tunnels.”.
This is a data visualization of Vivaldi’s Four Seasons. You should read it read clockwise. Size = note length Distance from center = pitch Colors = instruments.
In 2016, I had the opportunity to attend a session at the AAG conference where Ana Moreno-Monroy presented a very interesting paper analyzing inequalities in school accessibility by public transport in Sao Paulo. The paper is coming out in the Journal of Transport Geography and it's coauthored by Robin Lovelace and Fred Ramos, such a great team. I should also note that a big chunk of the data analysis was conducted in R using stplanr, a library for transport planning developed by Robin and Richard Ellison and which is a major contribution to the field.
In many large Latin American urban areas such as the São Paulo Metropolitan Region (SPMR), growing social and economic inequalities are embedded through high spatial inequality in the provision of state schools and affordable public transport to these schools. This paper sheds light on the transport-education inequality nexus with reference to school accessibility by public transport in the SPMR. To assess school accessibility, we develop an accessibility index which combines information on the spatial distribution of adolescents, the location of existing schools, and the public transport provision serving the school catchment area into a single measure. The index is used to measure school accessibility locally across 633 areas within the SPMR. We use the index to simulate the impact of a policy aiming at increasing the centralisation of public secondary education provision, and find that it negatively affects public transport accessibility for students with the lowest levels of accessibility. These results illustrate how existing inequalities can be amplified by variable accessibility to schools across income groups and geographical space. The research suggests that educational inequality impacts of school agglomeration policies should be considered before centralisation takes place.
Figure 2. Visual representation of the 12,697 OD pairs routed through the Google Distance Matrix API on an interactive map in RStudio, an open source data analysis platform.
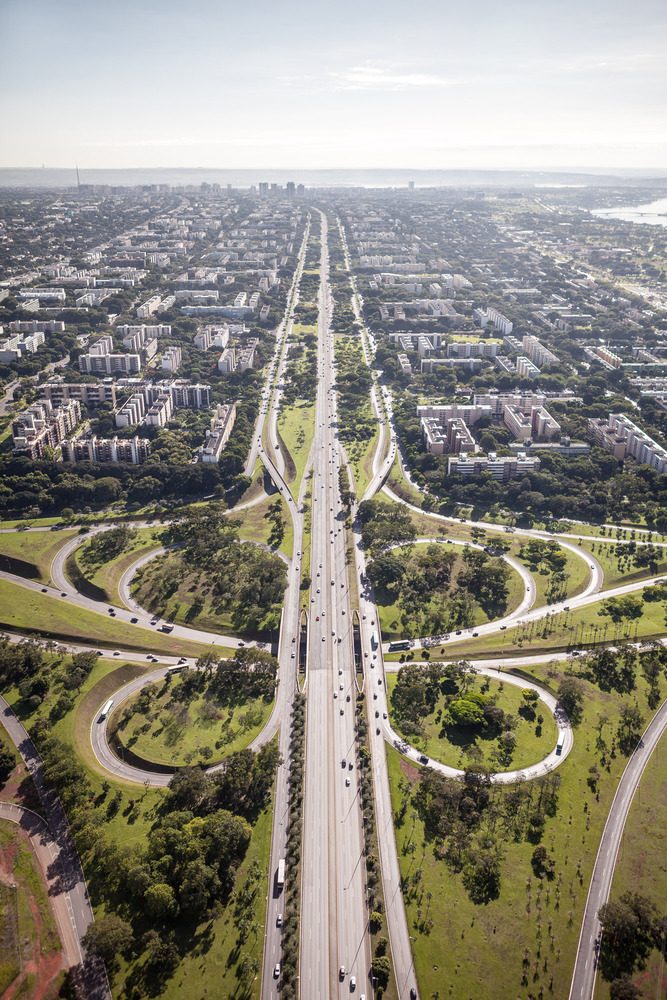
In the next couple of days, my partner and I are moving back to the lovely but car-dependent Brasilia, in Brazil . We had a wonderful time in the UK after three years in Oxford and one year in Cambridge. I don't have the words to say how much I appreciate the privilege it was to live among such vibrant and global academic communities and how eye-opening this whole experience has been. Time has flown by and I am now returning to my researcher position at the Institute for Applied Economic Research (Ipea).
It feels bittersweet going back to Brazil for various reasons. Perhaps the most important of them is the fact that I haven't finished my PhD yet. I am close to the end, though, and I will soon post some updates about my research.
I also must say it is impossible not to feel disappointed with the economic and political situation in Brazil these days. Nonetheless, I am glad to go back to home, where evidence-based policy is so much needed and where I will keep expanding my (inter)national collaborations. I'm particularly glad that I am going back to a great institution where I can use what I've been learning during my PhD to do policy relevant research. Looking forward to next chapters I need to finish my PhD first .
In the early 1950s, Kenneth Arrow published his PhD thesis where he demonstrated that it does not exist a method of converting individual preferences into a single group preference that is not limited by a 'voting paradox' at some point. Here is a great video explaining in layman's terms how Arrow's impossibility theorem works.
Needless to say how important this idea is for social choice theory and that it gave Arrow a Nobel Prize in economics. Curious fact. Five of Arrow's former students have won the Nobel Prize.
As some of you might remember from an earlier post, my PhD research concentrates on questions of transportation equity, particularly focusing on issues of transport accessibility and inequality of opportunities. Because there is a substantial overlap between my PhD and the research on spatial access to health services, I've read quite a few papers in this literature.
This is a well-studied topic with plenty of publications for those interested. if you would ask my opinion I would strongly recommend these two papers below. Together they give a good summary of the cutting-edge research and a very thorough review of various approaches to measuring transport access to health services.
A beautiful 3D reconstruction of the Brasilia madness. It is a shame the video forgot about the men and women who built the city, but it's still a beautiful tribute to the work of Oscar Niemeyer and Lucio Costa.