Wednesday, March 23, 2016

Urban Picture

This is a picture of Vila Amaury, a temporary village of 16,000 people in Brasilia - Brazil. Most of those people were construction workers who built public buildings in the city, including some ministries and the National Congress, the tall building you see in the picture. (ht Telmo Ribeiro)

The village was later covered by the water when the Paranoá River was dammed to create an artificial lake.


Saturday, March 19, 2016

How to argue on the internet


Thursday, March 17, 2016

Global Grid of Probabilities of Urban Expansion to 2030

Karen Seto and her group at Yale have recently made available a dataset of Global Grid of Probabilities of Urban Expansion, which presents spatially explicit probabilistic forecasts of global urban land cover change from 2000 to 2030 at a 2.5 arc-minute resolution. This is the dataset they used in their PNAS paper we have mentioned back in 2012.

Thanks Marcia Castro for the pointer.


Wednesday, March 16, 2016

The data 'is' or the data 'are' ?

Another great PhD Comic asking the big questions of Science, via Carl Schmertmann.


Thursday, March 10, 2016

Japan's aging population in R

Here is a nice GIF showing the population aging of Japan, and here is the script to make this animated population pyramid in R using ggplot. 

Kudos to Kyle Walker, author of this code and who you should definitely follow on Twitter and GitHub if you're interested in R, spatial analysis, data visualization and demography.

Japan_pyramid
credit: Kyle Walker

Tuesday, March 8, 2016

Sunday, March 6, 2016

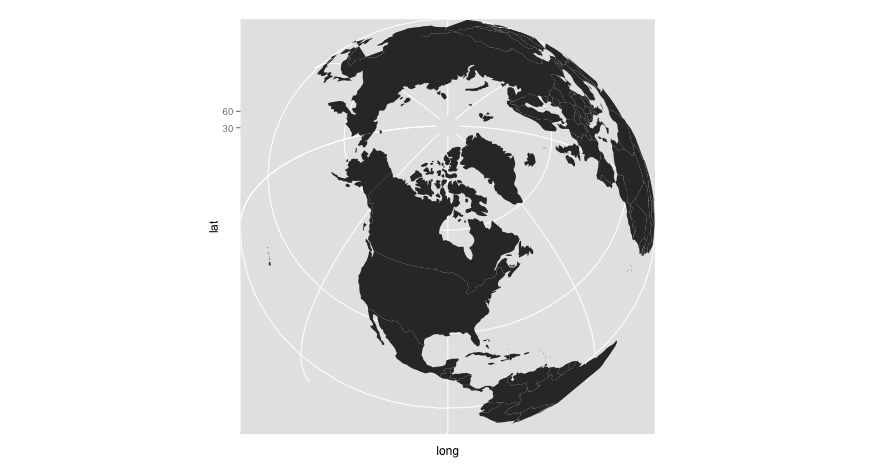
Making a Spherical World Map with R

Ewen Gallic has a post showing how to use R and ggplot2 to make spherical maps like the ones you see below. Go on and check out his website with some great R tutorials.


image credit: Ewen Gallic