Karen Seto and her group at Yale have recently made available a dataset of Global Grid of Probabilities of Urban Expansion, which presents spatially explicit probabilistic forecasts of global urban land cover change from 2000 to 2030 at a 2.5 arc-minute resolution. This is the dataset they used in their PNAS paper we have mentioned back in 2012.
Structured Procrastination on Cities, Transport Policy, Spatial Analysis, Demography, R
Thursday, March 17, 2016
Wednesday, March 16, 2016
Thursday, March 10, 2016
Japan's aging population in R
Here is a nice GIF showing the population aging of Japan, and here is the script to make this animated population pyramid in R using ggplot.
Kudos to Kyle Walker, author of this code and who you should definitely follow on Twitter and GitHub if you're interested in R, spatial analysis, data visualization and demography.
credit: Kyle Walker
Marcadores:
Aging,
Japan,
Population Pyramid,
R
Tuesday, March 8, 2016
Sunday, March 6, 2016
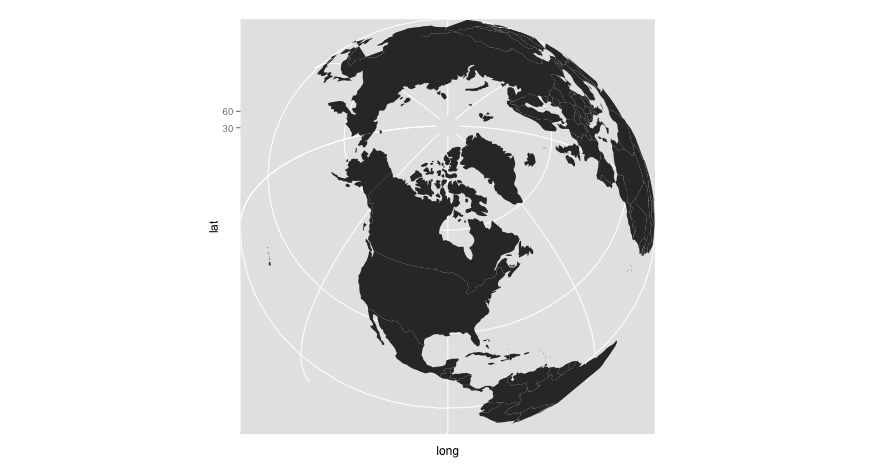
Making a Spherical World Map with R
Ewen Gallic has a post showing how to use R and ggplot2 to make spherical maps like the ones you see below. Go on and check out his website with some great R tutorials.
image credit: Ewen Gallic
Marcadores:
cartography,
R
Friday, March 4, 2016
Assorted Links
- The gap in life expectancy between the rich and the poor in the US is expanding
- Using maths and maps to figure out the identity of the world's most famous anonymous artist. Here is the paper
- Refugee camps from above, and here
- Using a 3D projection of the globe in QGIS
- Now you can rent Van Gogh’s Famous Bedroom on Airbnb in Chicago
- New SEDAC Hazards Mapper lets users estimate population in proximity to hazards, and assess exposure
- Mesmerizing ceilings of Mosques
- Nice chart showing how deadly is Ebola compared to other infectious diseases
- The average cost of a house at every London Underground stop
click on the image to enlarge it
Marcadores:
Assorted links,
cartography,
GIS,
Housing,
Life expectancy,
Mortality,
Subways
Thursday, March 3, 2016
webinar "Unlocking the Power of Big Data and Analytics for Mobility"
Heads Up: Urban Engines will be webcasting a promising seminar on March 22: “Faster. Better. Personalized. Unlocking the Power of Big Data and Analytics for Mobility.”
Sunday, February 28, 2016
Thursday, February 25, 2016
Wednesday, February 24, 2016
Where to find high spatial resolution data on population distribution
This post points you to six free sources of high spatial resolution data on population distribution.
5. [update Nov 2016] Eurostat and EFGS has also produced population-grid datasets in the years 2006 and 2011 for member countries of the European Union. They use a resolution of 1km and data from population and housing census. I thank Marcin Stepniak for the pointer.
6. Brazilian bonus: IBGE (the Census Bureau of Brazil) has also made publicly available a gridded population dataset with a resolution of 200 meters, which comes from the PhD thesis of Maria do Carmo Bueno at Nepo / Unicamp.
1. Gridded Population of the World (GPW) brings population estimates at a resolution of approx. 1km. This dataset results from a collaboration between CIESIN / Columbia University and Sedac / Nasa.
2. WorldPop brings population estimates at a resolution of approx. 100 meters for different years. This project goes a bit further as it also includes some population characteristics like age and sex structures, births, pregnancies, and poverty. The project is directed by Andy Tatem and it involves a number of collaborators from the University of Southampton, the University of Oxford, the World Bank and the Flowminder Foundation. They also do a fantastic job in terms of transparency, by getting their data and methods published in peer-review journals.
credit: Worldpop
3. More recently, CIESIN announced they are partnering with Facebook’s Connectivity Lab. The idea of the project is to create the highest resolution maps of population distribution ever created (5 meters) by applying image recognition algorithms to analyze high resolution satellite imagery. The project has already applied this method to 21 countries and the data output is gradually being released for download on their webpage (I thank Rafael Marinho for the pointer)
4. [update Oct 2016] Another source comes from the European Commission and its Global Human Settlement (GHS) framework, which combines fine-scale satellite imagery, census data, and volunteered geographic information. This project brings population estimates at resolutions of 250 meters and 1km approx for different years (1975, 1990, 2000 and 2015). I thank Jim for the pointer.
5. [update Nov 2016] Eurostat and EFGS has also produced population-grid datasets in the years 2006 and 2011 for member countries of the European Union. They use a resolution of 1km and data from population and housing census. I thank Marcin Stepniak for the pointer.
6. Brazilian bonus: IBGE (the Census Bureau of Brazil) has also made publicly available a gridded population dataset with a resolution of 200 meters, which comes from the PhD thesis of Maria do Carmo Bueno at Nepo / Unicamp.
Subscribe to:
Posts (Atom)