Time dynamics of the twitter conversation about the general strike of March 29, 2012 in Spain (by Esteban Moro via @tdn_2013)
Monday, May 6, 2013

Sunday, May 5, 2013
Assorted Links
- GPSing Your Cat
- London’s Changing Population
- Perhaps you should reconsider your PhD topic (via MR)
- Two good reasons to make a trip to China
- Is there a shortage of STEM workers in the USA? Yes, No, Depends
- Home prices in some U.S. metropolitan areas
- The new issue of the Journal of Transport and Land Use is out
- "WTF" link: Richard Nixon and Robocop ?!
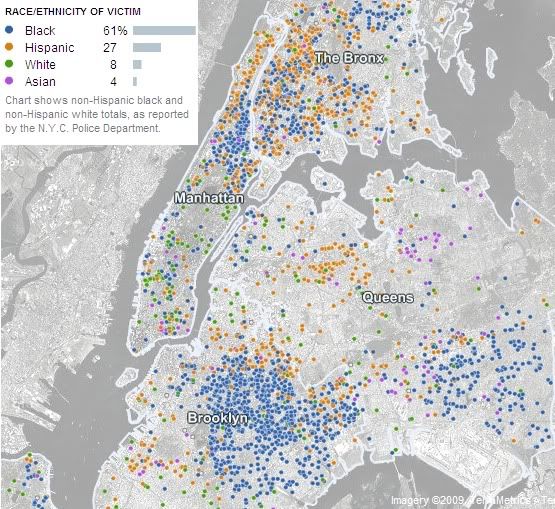
- An
oldinteractive map with lots of info on murders in NY

Friday, May 3, 2013
Data on educational attainment and quality
For those interested in education research and policy, I'd like to share two recent papers on educational attainment and quality:
By the way, these databases have recently been updated (and they are available for download)
Thursday, May 2, 2013
Using Cell-Phone Data to Improve our Cities
Imagine what questions you could answer if you had access to movement data collected from millions of cell-phone users. These kind of data bring and endless potential for research in several areas such as transportation, epidemiology, social networks and civil defense. MIT is holding this week the NetMob 2013 Conference, a conference focused on mobile phone data analysis. There are several interesting papers that are really pushing the envelope.

A paper by Francesco Calabrese and colleagues stands out as they have developed an interactive system to optimize public transit networks using mobile phone data under the Orange D4D Challenge*. Still, I believe there's something to improve in using such kind of data in a way that differentiates people from higher and lower income groups.
*Orange, a big telecom carrier, lauched a challenge last year called "Data for Development" (D4D). In short, you could send them a 250-words research project and get access within a week to a really large mobile phone dataset containing 2.5 billion records (calls and text messages) exchanged between 5 million anonymous users in Ivory Cost. Many papers presented at NetMob 2013 Conference were developed using Orange D4D data.
By the way, the Senseable City Lab (MIT) is also working on a related project (Signature of Humanity) trying to look at mobility patterns comparing New York, London, and Hong Kong. Here's a promotional video:
Wednesday, May 1, 2013
Efficiency Comparison of Pathfinding Algorithms
A very cool interactive comparison of efficiency in pathfinding algorithms (via @hmason). A nice thing to play with during boaring meetings.

Assorted Links
- The Central Bank of Brazil has come up with a new Real Estate Price Series
it was about time(via Drunkeynesian) - A new paper that has been shaking up Malthus's theory (and an institutionalist reinterpretation of Malthus)
- The Journal of Unpublished Results (via Bernardo Furtado)
- Attribution of CO2 emissions from Brazilian deforestation to consumers between 1990 and 2010
- Pervasive Externalities at the Population, Consumption, and Environment Nexus, a new paper published at Science, by Dasgupta and Ehrlich
- An impressive Skyscraper
- Agent-based models are getting more interactive (via M Batty)
- Urbanization and Climate Change Hazards in Asia via (Sebastien Goulard)
- Really impressive TweetMap ALPHA developed by Harvard University's Center for Geographic Analysis (via infosthetics)

Monday, April 29, 2013
Moving to R
I have finished my third week of introductory classes on R using RStudio and I must say I'm a converted. I know R can be disproportionately complicated to do a few simple things (such as pie charts or box plot) and I noticed how it can be discouraging because of that. However, it can also turn complicated ideas into just a few simple code lines (a good example). It's extreamily flexible. So I've decided I'm gradually moving to R. I know it will take some time, but it will eventually be completed.
As a consequence, from now on we'll have more R-related posts convering useful tips for urban and demographic studies.
note. I was first introduced to SPSS during my Sociology undergrad. And even though I have had SAS classes and a little contact with STATA, I got stuck with SPSS. I know I shouldn't be saying this out loud. But I'm ready to move on now.
Related Links:
note. I was first introduced to SPSS during my Sociology undergrad. And even though I have had SAS classes and a little contact with STATA, I got stuck with SPSS. I know I shouldn't be saying this out loud. But I'm ready to move on now.
Related Links:
Saturday, April 27, 2013

Subscribe to:
Posts (Atom)