Friday, December 24, 2010

Biographical note


I was hit by a bus yesterday.

Something I definitely could live without. But it's holiday time so I'll try to be optimistic and repeat to my self: “Una desgracia con suerte” (words of wisdom by Belen, a friend of mine).


Tuesday, December 21, 2010

Assorted links on Spatial Segregation


  • Post: On sputtering integration in Toronto (by Demography Matters)

  • Demographic Buffet: explore data from the Census Bureau's American Community Survey at the block level: race and ethnicity, income, education, and housing and families. (by the NY via FlowingData)

  • Article: Blacks and Hispanics Take Different Segregation Paths (by Brookings).
    - Segregation Data: Download segregation measures for U.S. states and the 100 largest metropolitan areas

  • extra link: US Census 2010 - first data release. (via Urbanophile)
    - Presentation
    - The data!


Friday, December 17, 2010

The rise and fall of Urban Sociology (?)


Google has scanned 15 million books originally published from 1800 on. And they have also developed the Google Books Ngram Viewer. It's a tool that charts the usage of any word over time in literature and other books (Google books database). One could irresponsibly use it as a proxy for the popularity of words in literature. And I did!


This chart above shows how often "Urban Sociology" has appeared in the literature (Google database - english literature only) since 1800. It looks to me that the Chicago School have had played an important role in the rising 'popularity' of Urban Sociology*. And it looks that Urban Sociology is not as 'popular' as it used to be....

*obviously, it would be necessary to scrutinize other keywords to conclude this (such as the major researchers in the first Chicago School)


And here are some queries of other keywords of interest:

And my favorites:

Traffic Jam:


Urban sprawl, compact city, smart city, smart growth, compact growth, New Urbanism.


Thanks Vinicius Netto for the tip!

Thursday, December 16, 2010

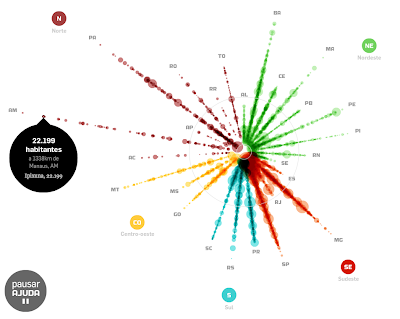
Population dispersion infographic

This infographic shows the municipalities population distribution in relation to the distance from the capitals of Brazilian states (preliminary data from Census 2010)*.

Move the mouse over the points /stantes/regions to explore them. You can also click and drag the outer circle to calculate how many live in a range of (i.g.) 300 km from the capitals.

Thanks Prof. Romulo Krafta for the tip.

*It's a peculiar way to visualize urban hierarchy as well.

(By Carlos Lemos via Estadão)

Monday, December 13, 2010

off-topic: Top Pictures of 2010

If you are not really in the mood for work: You might like these very good pictures of 2010 - Part 1 and Part 2. I do not have enough adjectives to describe 2010 but the pictures help a little.

ps. and don't forget to listen to Stan Getz on the right.

(Photo by Fabrizio Bensch/ REUTERS)

Friday, December 10, 2010

You get all the data you can eat!

(picture by Matthias Tunger via Gettyimages)


The Technology Review (a blog published by MIT) posted a list of The 70 Online Databases that Define Our Planet (the original list was done by Helbing and Balietti)*.
So I picked up a few of them that would fit the research interests of this blog authors (me and you all):


Metropolitan Travel Survey Archive
The Metropolitan Travel Survey Archive to store, preserve, and make publicly available, via the Internet, travel surveys conducted by metropolitan areas, states and localities.

National Household Travel Survey
The National Household Travel Survey (NHTS) collect data on both long-distance and local travel by the American public. The joint survey gathers trip-related data such as mode of transportation, duration, distance and purpose of trip. It also gathers demographic, geographic, and economic data for analysis purposes. It is part of RITA.


Large collection of datasets covering economics, demographics. Extractions are freely available, full access requires subscription.

OpenStreetMap
OpenStreetMap (by UCL) is a free editable map of the whole world. OpenStreetMap allows you to view, edit and use geographical data in a collaborative way from anywhere on Earth.

Gapminder Data
Gapminder is a popular technology and Web application for cross-visualisation of trends in time series of data. It also opens an archive of multiple datasets on diverse socio-economic indicators.


* ps. It’s awkward that they didn’t mentioned the UN Population Prospects nor The Human Mortality Database.

Sunday, December 5, 2010

Dubai Urbanization (1973-2006)

No wonder Dubai is known as The Sudden City.


Source: NASA images created by Jesse Allen, Earth Observatory, using data provided by Laura Rocchio, Landsat Project Science Office.


The town of Dubai first conducted a census in 1968 (with approximately 59,971 inhabitants then). The city reached a population of 183 thousand in 1975. According to the Statistics Centre of Dubai, the population of the emirate is estimated to be over 1,800,000 as of 2010. (Active Population During the Day: 2,885,459 !) Persistent strong population growth. Do the math!


Photo Credit: Miragestudio7.


And here is a beautiful Timelapse video of Dubai: Sky.

Thursday, December 2, 2010

Brazilian Census 2010: first results

This 4-minute video shows Luiz de Oliveira (from IBGE) talking about the preliminary results of the 2010 Brazilian Census (Population growth rate, Fertility rates, urbanization, regional disparities and migration).
(unfortunately the video is available in portuguese only)

Not so exciting as Hans Rosling, but still interesting.

Thanks to (o)ecocidades.