A nice and short video by PhD TV and Joao Pedro De Magalhaes showing a biological perspective on aging (ht Marcia Castro).
Friday, November 29, 2013
Tuesday, November 26, 2013
off-topic: An instagram short film
It's been a while since I don't post any time-lapse videos. But this video here is special because it takes the time-lapse idea in reverse. Instead of taking sparse pictures of one same scene, it takes instagram pictures taken by different people in separate moments and gathers them as if they were one single scene. Nice work by Thomas Jullien (ht Felipe Seigman)
Monday, November 25, 2013
The determinants of agglomeration in Brazil: input-output, labor and knowledge externalities
Aguinaldo Maciente is a great colleague of mine at Ipea. He finished his PhD at Illinois (Urbana-Champaign) a few months ago. It could be particularly interesting to those readers working in Regional Science, Migration studies, Labor Markets and Geographic Labor Mobility.
Thesis: The determinants of agglomeration in Brazil: input-output, labor and knowledge externalities.
Abstract:
This research investigates industry agglomeration and coagglomeration patterns in Brazil, and assesses their association with the Marshallian forces that are commonly viewed as sources of agglomeration economies, namely the input-output and labor pooling externalities. Knowledge externalities, the third classic source of Marshallian agglomeration economies, are partially captured through labor-embodied knowledge usage. [...] The ONET database, which contains several skill measures for US occupations, is matched with Brazilian occupations and factor analysis is used to produce a set of ONET skill and knowledge groups. These skills groups are intended to describe the labor profile of industries and regions and constitute the basis for measures of labor and labor-embodied knowledge externalities for pairs of industries. The measures of input-output linkages and labor-use similarity are related to the observed agglomeration and coagglomeration patterns, in order to test for the possible sources of agglomeration economies in Brazil. Results indicate that Brazil has agglomeration levels, as measured by Ellison and Glaeser’s (1997) agglomeration index, that are slightly decreasing over time, but comparable to the international experience. However, the components of the agglomeration index reveal that Gini-type regional employment concentration and plant-level employment concentration are relatively high, despite their decrease from 1994 to 2010. That is, Brazil has most of its employment concentrated into relatively fewer regions and plants, when compared to results found in the literature, for example, for the United States. [...] Overall colocation patterns in Brazil seem to be more associated with labor and labor-embodied knowledge externalities than with input-output externalities. Natural advantages, such as agricultural and mining potential and road density are also positively associated with observed coagglomeration [...]
Wednesday, November 20, 2013
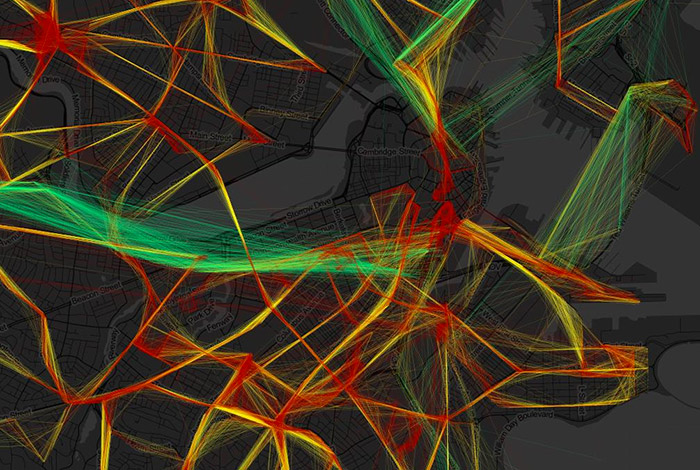
Detailed Animation of Travel Surveys
Despite the amazing potential of new technologies (eg social media, mobile phones) to inform us about spatial patterns in urban mobility, traditional Household Travel Surveys are still a key source of data with preciously detailed information on socio-economic and demographic characteristics.
Recently, Fletcher Foti (Ph.D. student at Berkeley) created a striking detailed animation daily travel patterns using the most recent surveys from the San Francisco Bay Area, Los Angeles, and New York. You may check the animation here and have more information at Emily Badger's post.
ps. If you are interested in travel surveys, you should take a look at the Related Links, below.

[Image Credit: Fletcher Foti, Synthicity]
Monday, November 18, 2013

Thursday, November 14, 2013
Assorted Links
- A renewed look at Europe's population distribution (high resolution map)
- Transport costs in the Roman Empire (via Leo Monasterio)
- Like camels with tatoos
- How many countries already face shrinking population?
- What does your smart phone say about much sex you have had?
- Live map with every cargo ships around the world (via Leo again). And a nice visualization of shipping in the Baltic Sea.
- Labor productivity Around the World
- The First Economist
Wednesday, November 13, 2013
Low-cost interventions on public space
A short presentation by Janette Sadik-Khan (New York transportation comissioner) talking about the recent low-cost interventions on public space in NY. I am keen to read new studies assessing these interventions under different perspectives (urban mobility, housing, segregation, accessibility, real state, market sales etc). I hope there is someone out there doing research on this.
Tuesday, November 12, 2013
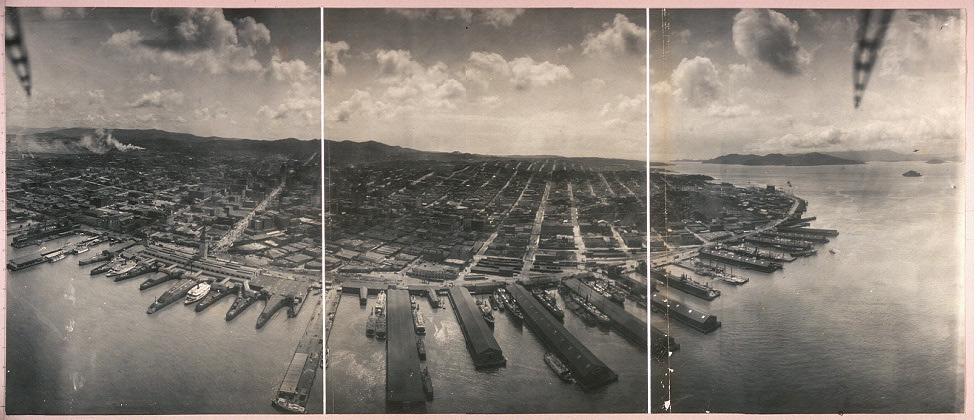
Urban Picture
San Francisco after the 1906 earthquake, by George R. Lawrence
Brooklyn Bridge (1913), by Irving Underhill

Sunday, November 10, 2013
Mining bicycle sharing data around the globe
Oliver O’Brien is gradually becoming a great expert on bike-sharing systems. Together with James Cheshire and Michael Batty, Oliver published a paper last month analyzing an impressive amount of data from 38 systems around the globe.
Abstract:
" [...] This paper is the first to take a global view of bike-sharing characteristics by analysing data from 38 systems located in Europe, the Middle East, Asia, Australasia and the Americas. To achieve this, an extensive database depicting the geographical location and bicycle occupancy of each docking station within a particular system has been created over a number of years to chart the usage in the chosen systems (and others) and provide a consistent basis on which to compare and classify them. Analysis of the variation of occupancy rates over time, and comparison across the system’s extent, infers the likely demographics and intentions of user groups. A classification of bike-shares, based on the geographical footprint and diurnal, day-of-week and spatial variations in occupancy rates, is proposed. [...] "

[Image Credit: Oliver O’Brien]
Related Links:
Saturday, November 9, 2013
Friday, November 8, 2013
Assorted Links
- What if all hte ice melted?
- A Gray Future for the BRICsLike OCR for maps: Automating Extracting GIS Data from Scanned Maps (via @QUBDH @digitalurban)
- Female Employment and Fertility in China
- Chinese food Density by Neighborhood in NYC (via Untapped Cities)
- Perfecting bike share schemes via (HumanScaleCity)
- Golf Ball 70,000fps 150mph
- Autonomous vehicles and self-driving buses closer to reallity (via MR)
- Map of scientific collaboration between researchers (old stuff but still interesting)

Wednesday, November 6, 2013

The trend of income segregation in the US, 1970-2009
"In 1970, 65 percent of families lived in middle-income neighborhoods; by 2009, only 42 percent of families lived in such neighborhoods".
This is from a report recetly published by Kendra Bischoff and Sean Reardon showing the trend in residential segregation by income in the US between 1970 and 2009. (via Tyler Cowen)
[click on the image to enlarge it]

[Image Credit: Bischoff and Reardon, via Mother Jones]
Monday, November 4, 2013
Bus speeds visualized in real time
As you can see here, Andy Woodruff is a quite talented cartographer! In june this year he released this interactive map where you can visualize (almost in real time) the bus routes and speeds in Boston.
More information at Bostonography blog.
Related Link:
Quote of the Day
“Anyone who believes in indefinite growth on a physically finite planet is either mad, or an economist.”
Sunday, November 3, 2013
What a million lines of code look like?
[click on the image to enlarge it]

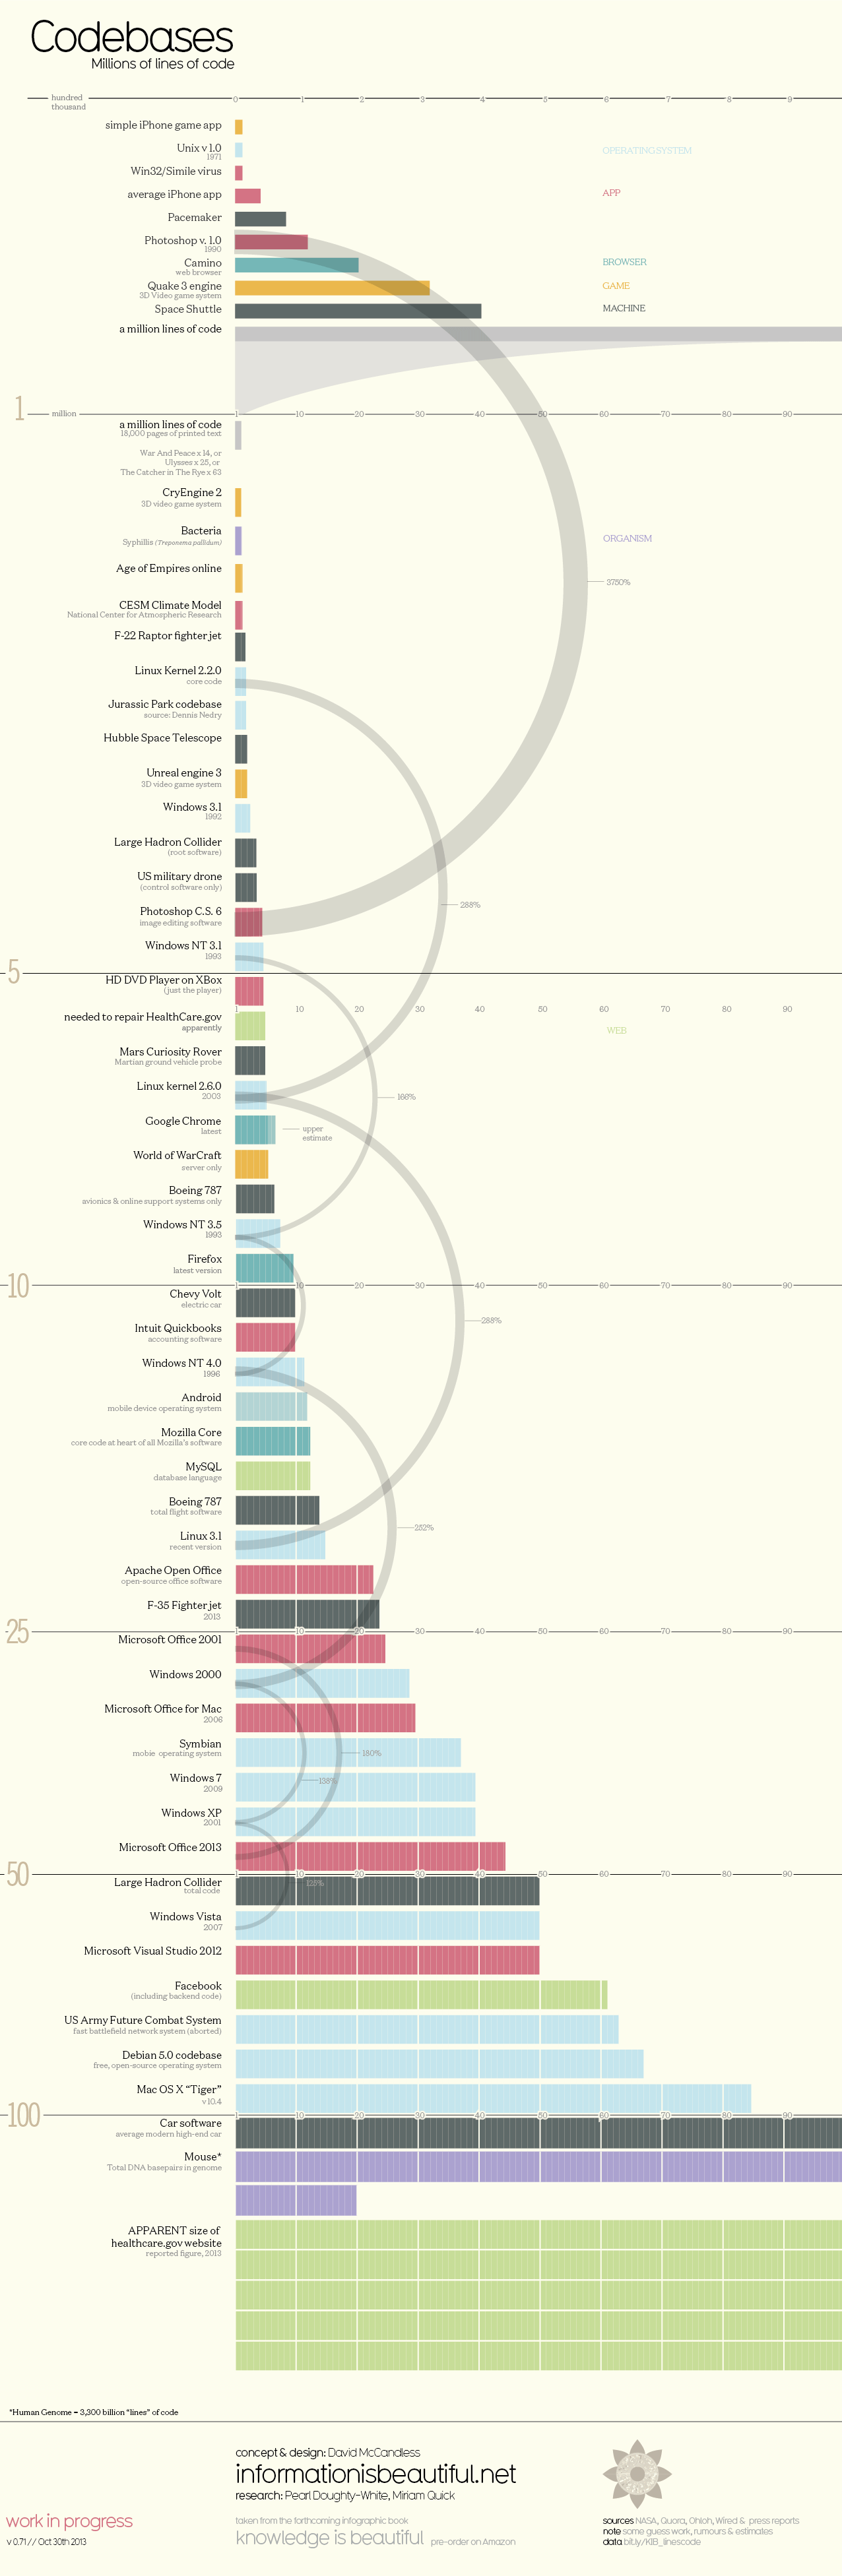
How many lines of code does it take to build an Iphone app, to build Windows 7 operational system, or to operate a Boeing 787?
What a million lines of code look like? What about 500 million lines? You can cilck on the image to check it out (via Information is Beautiful).
[Image Credit: Information is Beautiful]
What a million lines of code look like? What about 500 million lines? You can cilck on the image to check it out (via Information is Beautiful).
[Image Credit: Information is Beautiful]
Subscribe to:
Comments (Atom)