Structured Procrastination on Cities, Transport Policy, Spatial Analysis, Demography, R
Tuesday, May 31, 2016
Friday, May 27, 2016
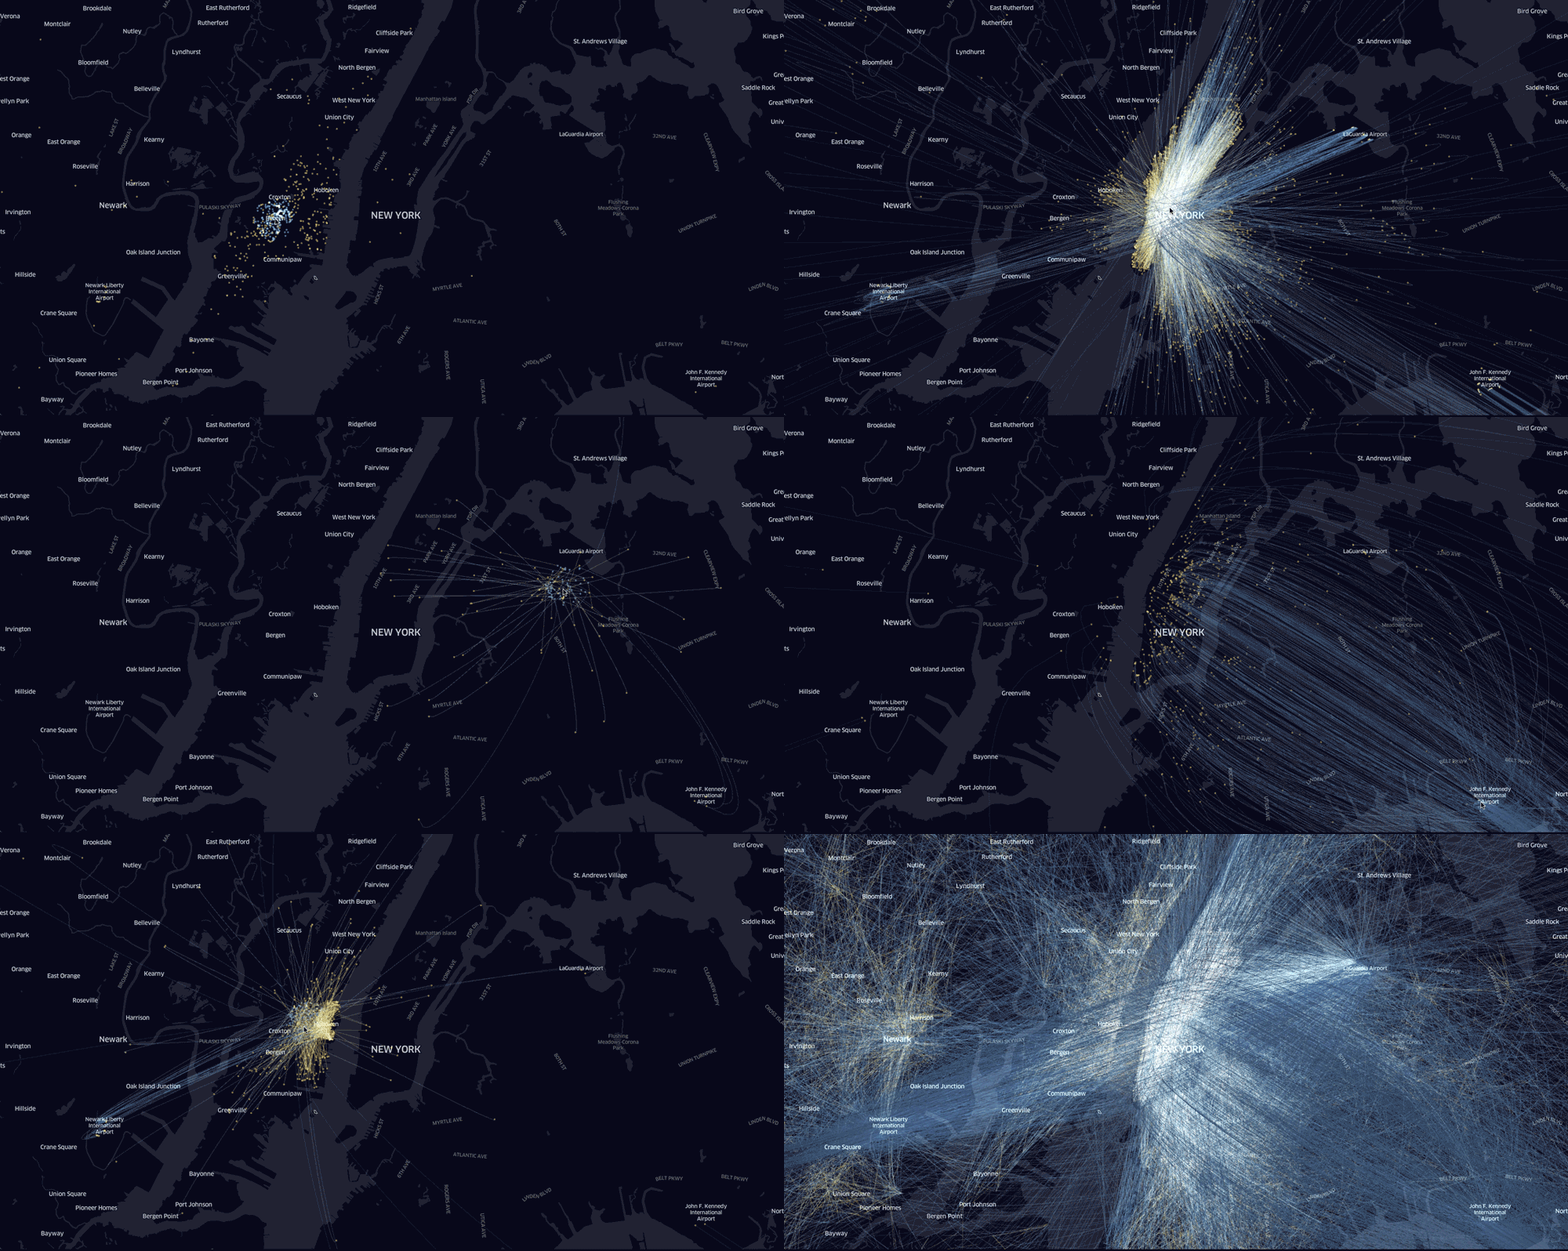
Commuting hinterland of major UK cities
Alasdair Rae (who has a great blog by the way) has posted a nice short collection of maps comparing the commuting hinterland of some major UK cities.
City Footprints: follow-up blog on commute patterns for lots of cities https://t.co/7fSGdPL18q cc @RileyResearch pic.twitter.com/MkuhCx79Xd— Alasdair Rae (@undertheraedar) 27 May 2016
Marcadores:
commuting
Tuesday, May 24, 2016
Simulados: agent-based computer simulations
A nice video of the Barcelona Supercomputing Center on the use of agent-based computer simulations to study societies. Via Andy Kirk.
Marcadores:
Video
Sunday, May 22, 2016
Thursday, May 19, 2016
I'm presenting at UCL next week - Transport legacy and the redistribution of Urban Accessibility
I will present a case study on the transport legacies of the 2016 Olympic Games in Rio de Janeiro (Brazil) and discuss the distributive aspects of how such developments affect different income groups in terms of their transport accessibility to hospitals, schools and job opportunities. This is one of the papers of my doctoral research, so I'd be glad to get any feedback if I don't put the audience to sleep .
Marcadores:
Accessibility,
bio
Tuesday, May 17, 2016
Assorted Links
- Who's downloading pirated papers? Everyone
- How Uber engineers an efficient route, via Renato Arbex
- Nairobi's first geo-coded accident dataset
- Higher Gender Wage Gap is associated with higher Domestic Violence rates
- Ten tips for Portuguese speakers writing scientific research papers in English (Carl Schmertmann)
- book: Modeling Cities and Regions as Complex Systems: From Theory to Planning Applications
- In case you would like to buy me a gift. Just saying...
- The Spread of US Slavery (1790 – 1860) and Bill Rankin's version of that map
Marcadores:
Academic writing,
Assorted links,
cartography,
gender,
History
Saturday, May 14, 2016
How I feel trying to solve a problem in my research
This is how I've been spending my days lately. #PhDlife
Friday, May 13, 2016
Electric car fact of the day
There are currently more #electriccars charging spots in Japan than in Europe + US combined https://t.co/E8CR8z4zxQ pic.twitter.com/klL2dai6oo— TSU Oxford (@TSUOxford) 6 May 2016
Marcadores:
electric vehicles
Thursday, May 12, 2016
Traffic Jam without bottleneck
Last week, I posted a link to a terrific visual and interactive explanation of the difference between Gridlock and Bottlenecks.
I guess one could say gridlocks are one of the causes of traffic jam when there is no bottleneck. This video shows a real demonstration of this. (via Gonçalo Correia)
Marcadores:
Congestion,
Video
Wednesday, May 11, 2016
Justice and ethical concerns in Energy decisions
The latest issue of Nature Energy is out. There is an interesting paper that puts together a miscellaneous of concepts from different theories in political philosophy to build an "energy justice framework centred on availability, affordability, due process, transparency and accountability, sustainability, equity and responsibility".
The authors recognize eventual conflicts between these different ideas but I think they don't make it very clear how the ethical framework they propose actually overcomes such conflicts. In any case, it's a good read.
Thanks Tim Schwanen for the tip.
Marcadores:
environment,
Justice
Tuesday, May 10, 2016
Detecting Spatial Clusters of Flow Data
Tao, R. and Thill, J.-C. (2016), Spatial Cluster Detection in Spatial Flow Data. Geographical Analysis. doi: 10.1111/gean.12100
Abstract:
Abstract:
As a typical form of geographical phenomena, spatial flow events have been widely studied in contexts like migration, daily commuting, and information exchange through telecommunication. Studying the spatial pattern of spatial flow data serves to reveal essential information about the underlying process generating the phenomena. Most methods of global clustering pattern detection and local clusters detection analysis are focused on single-location spatial events or fail to preserve the integrity of spatial flow events. In this research a new spatial statistical approach of detecting clustering (clusters) of flow data that extends the classical local K-function, while maintaining the integrity of flow data was introduced. Through the appropriate measurement of spatial proximity relationships between entire flows, the new method successfully upgraded the classical hot spot detection method to the stage of “hot flow” detection. Spatial proximity of flows was measured by a four-dimensional distance. Several specific aspects of the method were discussed to provide evidence of its robustness and expandability, such as the multiscale issue, relative importance control and adaptive scale detection, using a real dataset of vehicle theft and recovery location pairs in Charlotte, NC.
image credit: Tao, R., & Thill (2016)
Marcadores:
dataviz,
spatiotemporal,
statistics
Saturday, May 7, 2016
Dumb Ways to Die in Rio
A cute video to celebrate the coming of the Olympic Games this year.
Marcadores:
Rio de Janeiro
Wednesday, May 4, 2016
Data analytics and visualization at Uber
Here is a neat 3D animated map showing a full day of anonymized Uber trips in Los Angeles. You can also read Nicolas Belmonte on how Uber has been using data analytics and visualization in their work at Uber.
Dragging the cursor over a given radius area reveals distributions of Uber dropoffs in real-time. This is pretty cool. I was wondering if someone would be up for the challenge of building a similar interactive map with Shiny in R.

Monday, May 2, 2016
Assorted Links
- Night lights and regional income inequality in Africa
- Will autonomous vehicles really be safer than conventional cars? Here is why answering this question is not so simple via Tyler Cowen
- Real-time visualization of Ebola evolution and geographic spread
- Higher Gender Wage Gap is associated with higher Domestic Violence rates
- The Global Metro Monitor 2014
- Some Beautiful Abandoned Places In Europe
- How Americans Get to Work, neat interactive dataviz by Nathan Yau
- Nice tool for comparing the size of countries, ht Pablo Astudillo
- A terrific visual and interactive explanation of Gridlock vs. Bottlenecks, by Lewis Lehe
Marcadores:
Assorted links,
autonomous vehicles,
commuting,
dataviz,
gender,
Inequality,
Metropolitan Areas,
spatiotemporal
Subscribe to:
Comments (Atom)


