Showing posts with label Urbanization. Show all posts

Monday, April 13, 2020

The delineation and growth of metropolitan areas in the world between 2000 and 2015

A talented team at the OECD and the European Union have developed a consistent method to delineate metropolitan areas – or functional urban areas (FUAs) – in the entire world. They recently published an open access paper where the explain the method and use it to analyze the population growth of metropolitan areas in the world between 2000 and 2015. You can find more info about the paper below and  a geopackage data set of  FUAs can downloaded from here. 

Moreno-Monroy, A. I., Schiavina, M., & Veneri, P. (2020). Metropolitan areas in the world. Delineation and population trends. Journal of Urban Economics, 103242. 

Abstract
This paper presents a novel method to delineate metropolitan areas – or functional urban areas (FUAs) – in the entire world and assesses their population trends. According to the definition developed by the OECD and the European Union, FUAs are composed of high-density urban centres with at least 50 thousand people plus their surrounding commuting zones. The latter represent the urban centres’ areas of influence in terms of labour market flows. The proposed method combines a functional and a morphological approach to overcome the dependency on travel-to-work data to define commuting zones and allow a global delineation. It relies on a probabilistic approach and the use of population and travel impedance gridded data across the globe. Results show that around 3.9 billion people, making up 53% of the world population, live in 8,790 FUAs, out of which 17% live in their commuting zones. Between 2000 and 2015, population growth was higher in larger FUAs, highlighting a general trend toward higher concentration of the metropolitan population. Commuting zones grew faster than urban centres, though with heterogeneous patterns across world regions, income levels and metropolitan size.


Related posts:

Saturday, October 26, 2019

The urban footprint of the largest urban areas of Brazil

All my procrastination energy led to me to create this nice little image comparing the footprint of the largest urban agglomeration in Brazil. I created this figure using R and geobr, a package that facilitates downloading official geospatial data of Brazil (a quick intro to geobr here). In our latest update, we included official data on the urban footprint of all Brazilian cities in 2005 and 2015.


[click on the image to enlarge]

Tuesday, March 19, 2019

The race for the largest city in the world over the past 500 years

In previous posts, I've pointed out to an incredible open dataset with comprehensive population estimates of human settlements and cities for the past 6,000 years. The talented John Burn-Murdoch used some of these data to create this nice animation showing the changing ranks of the 10 largest cities in the world since 1500. The full code for the animation is available here.

Tuesday, December 12, 2017

High-resolution data sets on global man-made impervious surfaces and urban extents

In 2012, we posted about a big research project on global forecasts of urban expansion and its environmental impacts, by Karen C. Seto and her lab at Yale. On a related topic, SEDAC (a NASA data center hosted at CIESIN in Columbia University) has released two new high-resolution data sets that some of you might find useful for your own research:

  1. Global Human Built-up And Settlement Extent for the target year 2010, derived from global 30m Landsat satellite data

  2. Global Man-made Impervious Surface for the target year 2010, derived from global 30m Landsat satellite data

Monday, February 6, 2017

How much of the world is covered by cities? not much

Vinicius Netto asked this question a few days ago. Here is the answer I've found based on a paper by Seto and colleagues.


Monday, January 23, 2017

An open dataset with 6,000 years of global urbanization

Patrick Gerland points to a new paper/open dataset that provides the first spatially explicit archive of the location and size of urban population settlements over the last 6,000 years. We have previously posted in this blog about the fantastic work of Karen Seto and her group at Yale at the Seto lab on Urbanization and Global Change (here and here). This one adds up to a great and continuous effort on improving spatially explicit models of population growth and urbanization, with important contributions to historical and prospective research.


Reba, M., Reitsma, F., & Seto, K. C. (2016). Spatializing 6,000 years of global urbanization from 3700 BC to AD 2000. Scientific data, 3.

Abstract:
How were cities distributed globally in the past? How many people lived in these cities? How did cities influence their local and regional environments? In order to understand the current era of urbanization, we must understand long-term historical urbanization trends and patterns. However, to date there is no comprehensive record of spatially explicit, historic, city-level population data at the global scale. Here, we developed the first spatially explicit dataset of urban settlements from 3700 BC to AD 2000, by digitizing, transcribing, and geocoding historical, archaeological, and census-based urban population data previously published in tabular form by Chandler and Modelski. The dataset creation process also required data cleaning and harmonization procedures to make the data internally consistent. Additionally, we created a reliability ranking for each geocoded location to assess the geographic uncertainty of each data point. The dataset provides the first spatially explicit archive of the location and size of urban populations over the last 6,000 years and can contribute to an improved understanding of contemporary and historical urbanization trends.

credit: Reba, Reitsma and Seto

Friday, December 2, 2016

Brasilia, 32 years of urban expansion

Google Earth Engine has released new data for their project Timelapse, which combines over 5 million satellite images acquired over the past three decades and allows for a zoomable video of land transformations at a global scale. You can play around  procrastinate  on their website zooming in different areas. I find Dubai and Las Vegas particularly interesting. There is a good playlist on Youtube!

This is the timelapse of Brasilia (Federal District), my hometown. During this period between 1984 and 2016, the population of Brasilia went from approx. 1.2 million to 2.9 million. The video shows some very interesting transformations including the expansion of poor settlements largely undeserved by urban infra-structure in the south and southwest of the city, but also some illegal occupations of protected areas by middle- and high-income gated communities in the east and north-east parts of the city.


Thursday, March 17, 2016

Global Grid of Probabilities of Urban Expansion to 2030

Karen Seto and her group at Yale have recently made available a dataset of Global Grid of Probabilities of Urban Expansion, which presents spatially explicit probabilistic forecasts of global urban land cover change from 2000 to 2030 at a 2.5 arc-minute resolution. This is the dataset they used in their PNAS paper we have mentioned back in 2012.

Thanks Marcia Castro for the pointer.


Monday, June 23, 2014

7 Misconceptions about Urbanization

George Martine (former president of the Brazilian Association for Population Studies ABEP) was the lead author of the UN Population Fund's (UNFPA) report State of World Population 2007: Unleashing the Potential of Urban Growth.

In this seminar, Martine discussed seven common misconceptions about urbanization (ht Eduardo Marandola).

  1. Urbanization is inherently bad
  2. Most urban growth occurs in mega cities
  3. Urban growth comes mainly from migration to cities
  4. Rural-Urban migration can and should be stopped
  5. The poor are a marginal minority in cities
  6. Cities occupy a huge amount of land area
  7. As a whole, urbanization inevitably harms the environment


Assorted links

Monday, April 7, 2014

200 years of Urban Expansion

We have mentioned the Atlas of Urban Expansion here at Urban Demographics a while ago. It is an amazing project supported by the Lincoln Institute of Land Policy that gathers loads of data for a number of cities across the globe.

Using part of these data, Shlomo Angel and the team at NYU Stern Urbanization Project have recently started working on a new series of great animations showing the expansion of 30 global cities over the last 200 years. Here are the first five cases: São Paulo, Chicago, Paris, London and Los Angeles:

obs. It's a great work and I'm looking forward for the next videos. The only reservation I would make is that these animations can be a bit deceiving as they give the impression of concentric urban expansion. 

Sunday, February 2, 2014

The City of 7 Billion

The City of 7 Billion is an ambitious research project on the impact of population growth and resource consumption at the global scale that reframes the entire world as a single urban entity: the city of 7 billion. The project is being conducted by Bimal Mendis and Joyce Hsiang of the Yale School of Architecture. 

More info on the project here and here.


A visualization of population growth in cities around the world from 1990 to 2015


Tuesday, October 29, 2013

Urban Picture

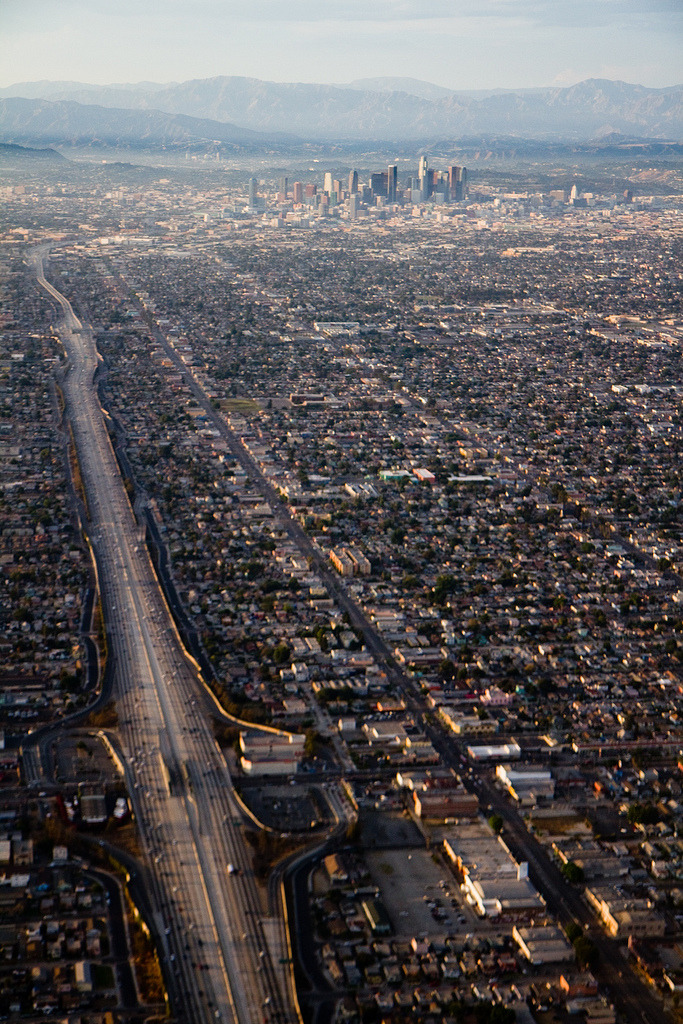
Would you call this urban sprawl? (via Human Scale Cities, a great blog by the way).
Los Angeles
[Image Credit: ?]

Soundtrack:

Tuesday, October 22, 2013

Demographic papers published on Science and Nature

It's not everyday you see demographers publishing on journals like Science and Nature. So here is a short list with some of the papers published since 2000.

ps. Massive presence of @IIASAVienna and @WiCVienna researchers!

and my two favorites:

[Image Credit: Lutz and KC, 2011]