Showing posts with label Aging. Show all posts

Friday, April 26, 2019

The global population pyramid from 1950 to 2100

New piece by Max Roser in Our World in Data, showing how global demography has changed and what we can expect for the 21st century.

In this figure below, curves in blue to green show how the global population pyramid changed from 1950 to today, while shades of yellow show the UN projections for the change expected until 2100.

click on the image to see full size


Monday, July 23, 2018

Mapping the diversity of population ageing across Europe with a ternary colour scheme

Ilya Kashnitsky and Jonas Schöley have recently published this correspondence in The Lancet where they show a very clever way to visualize the spatial heterogeneity of population age structures using choropleth map with ternary colour scheme. The data wrangling was done in R, and the code to replicate get the data and replicate the figure is available on Github.

Needless to say that, if you're interested in demography, R and data, you should be following the work and twitter accounts of Ilya and Jonas.

click on to image to enlarge it

image credit: Ilya Kashnitsky and Jonas Schöley.

Wednesday, May 31, 2017

Visualizing the concept of prospective aging with R

In two great papers published in Science and Nature, W. Sanderson and  S. Scherbov proposed a new way to understand population aging. Instead of focusing on the time people have lived, the authors take a prospective look at the number of years people are still expected to live.

This concept of "prospective aging" is nicely summarized by Ilya Kashnitsky in a blog post:
"The underlying idea is really simple – age is not static: a person aged 65 (the conventional border deliminating elderly population) today is in many aspects not the same as a person ages 65 half a century ago. Health and lifespan improved a lot in the last decades, meaning that today people generally have much more remaining years of life at the moment of being recognized as elderly by the conventional standards. Thus, Sanderson and Scherbov proposed to define elderly population based on the estimation of the expected remaining length of life rather than years lived. Such a refined view of population ageing disqualifies the alarmist claims of the approaching demographic collapse."
If you're interested in the topic, I would highly recommend reading the whole post (and the papers, of course). Ilya brings not only a nice summary of the concept, he also presents some R scripts to create animated population pyramids to visualize prospective aging.

 Ilya Kashnitsky writes a great blog and twitter about demographic research and R more broadly, and I would highly recommend following his work online.


Related Links:

Thursday, March 16, 2017

Demographic fact of the day


Nigeria is the fastest growing countries in the world. The population of Nigeria will nearly double in the next 30 years.

Very interesting episode of BBC's Economic Tectonics on how economic power will shift as the world’s population changes, by Ruth Alexander.


Saturday, April 9, 2016

Chart of the Day


Thursday, March 10, 2016

Japan's aging population in R

Here is a nice GIF showing the population aging of Japan, and here is the script to make this animated population pyramid in R using ggplot. 

Kudos to Kyle Walker, author of this code and who you should definitely follow on Twitter and GitHub if you're interested in R, spatial analysis, data visualization and demography.

Japan_pyramid
credit: Kyle Walker

Thursday, January 8, 2015

Nobel Dialogue on Population Aging

The Nobel Week Dialogue of last year was dedicated to the topic of population aging, with many interesting presentations (ht Population Europe and Bernardo Queiroz). I liked these two sessions in particular, but other presentations are also available here.


Related Links:

Wednesday, April 16, 2014

The Age of Peak Academic Performance

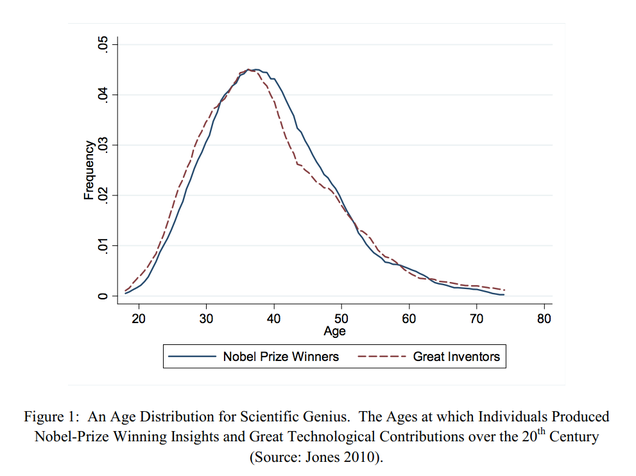
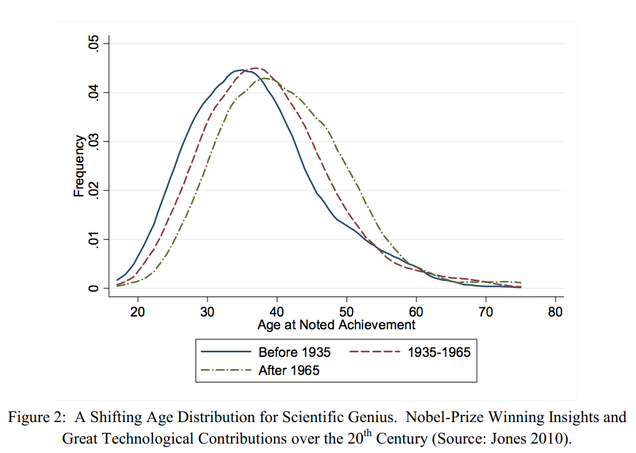
An interesting paper on the age of peak academic performance (via Bernardo L Queiroz).

Abstract:
Great scientific output typically peaks in middle age. A classic literature has emphasized comparisons across fields in the age of peak performance. More recent work highlights large underlying variation in age and creativity patterns, where the average age of great scientific contributions has risen substantially since the early 20th Century and some scientists make pioneering contributions much earlier or later in their life-cycle than others. We review these literatures and show how the nexus between age and great scientific insight can inform the nature of creativity, the mechanisms of scientific progress, and the design of institutions that support scientists, while providing further insights about the implications of aging populations, education policies, and economic growth.
[click on the image to enlarge it]


Friday, November 29, 2013

What is Aging (from a biological perspective)

A nice and short video by PhD TV and Joao Pedro De Magalhaes showing a biological perspective on aging (ht Marcia Castro).


Tuesday, October 22, 2013

Demographic papers published on Science and Nature

It's not everyday you see demographers publishing on journals like Science and Nature. So here is a short list with some of the papers published since 2000.

ps. Massive presence of @IIASAVienna and @WiCVienna researchers!

and my two favorites:

[Image Credit: Lutz and KC, 2011]

Sunday, July 28, 2013

China's policies for the aging population

The Oxford Chinese Economy Programme (OXCEP) promoted a series of workshops on June 2013. Here is the presentation by Prof. Zhao Yaohui (China Center for Economic Research at Peking University) on Chinese policies for the aging population.


Related Link:
  • Policies against poverty (Prof. Li Shi - Director of the China Institute for the Study of Income Distribution at Beijing Normal University)